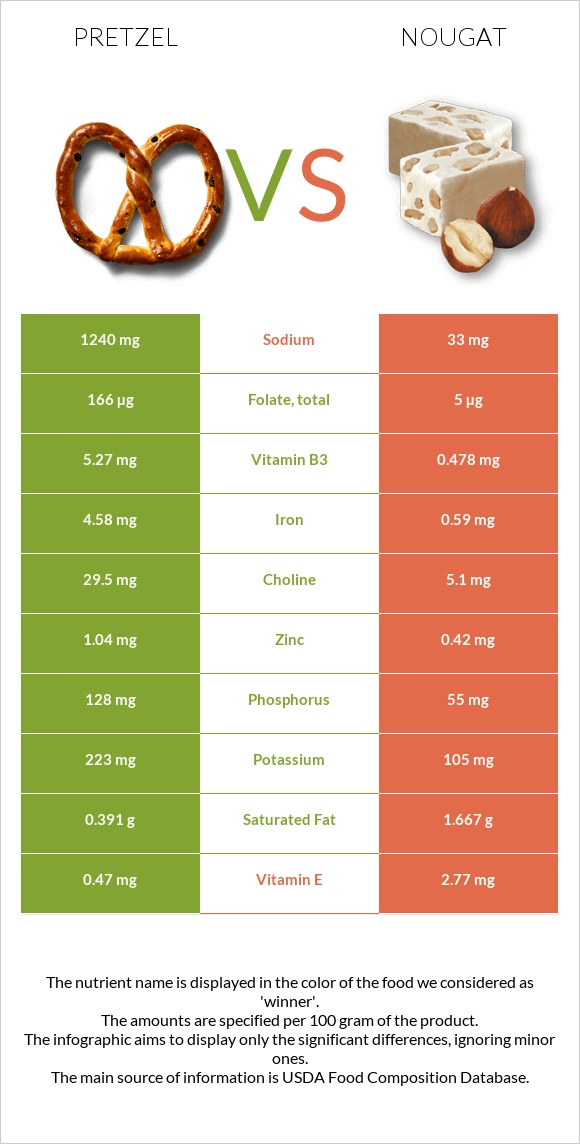
Summary of differences between pretzel and nougat Pretzel has more iron, folate, vitamin B1, manganese, vitamin B3, vitamin B2, and phosphorus; however, nougat is higher in vitamin E. Pretzel covers your daily need for sodium, 52% more than nougat. Pretzel has 33 times more folate than nougat. While pretzel has 166µg of folate, nougat has only 5µg. Nougat has less sodium. The glycemic index of pretzel is higher. These are the specific foods used in this comparison Snacks, pretzels, hard, plain, salted and Candies, nougat, with almonds .
Infographic
Mineral Comparison
Mineral comparison score is based on the number of minerals by which one or the other food is richer. The "coverage" charts below show how much of the daily needs can be covered by 300 grams of the food.
7
100 g
300 g
1 oz - 28.35g 10 twists - 60g
Magnesium
Magnesium
Calcium
Calcium
Potassium
Potassium
Iron
Iron
Copper
Copper
Zinc
Zinc
Phosphorus
Phosphorus
Sodium
Sodium
Manganese
Manganese
Selenium
Selenium
21%
8.1%
20%
172%
52%
28%
55%
162%
132%
24%
3
100 g
300 g
1 piece - 14g
Magnesium
Magnesium
Calcium
Calcium
Potassium
Potassium
Iron
Iron
Copper
Copper
Zinc
Zinc
Phosphorus
Phosphorus
Sodium
Sodium
Manganese
Manganese
Selenium
Selenium
23%
9.6%
9.3%
22%
45%
11%
24%
4.3%
40%
14%
Vitamin Comparison
Vitamin comparison score is based on the number of vitamins by which one or the other food is richer. The "coverage" charts below show how much of the daily needs can be covered by 300 grams of the food.
8
100 g
300 g
1 oz - 28.35g 10 twists - 60g
Vitamin C
Vit. C
Vitamin D
Vit. D
Vitamin A
Vit. A
Vitamin E
Vit. E
Vitamin B1
Vit. B1
Vitamin B2
Vit. B2
Vitamin B3
Vit. B3
Vitamin B5
Vit. B5
Vitamin B6
Vit. B6
Vitamin B12
Vit. B12
Vitamin K
Vit. K
Folate
Folate
7%
0%
0%
9.4%
106%
77%
99%
19%
17%
0%
7%
125%
2
100 g
300 g
1 piece - 14g
Vitamin C
Vit. C
Vitamin D
Vit. D
Vitamin A
Vit. A
Vitamin E
Vit. E
Vitamin B1
Vit. B1
Vitamin B2
Vit. B2
Vitamin B3
Vit. B3
Vitamin B5
Vit. B5
Vitamin B6
Vit. B6
Vitamin B12
Vit. B12
Vitamin K
Vit. K
Folate
Folate
1%
0%
0%
55%
3.3%
34%
9%
3.6%
4.6%
1.3%
0%
3.8%
All nutrients comparison - raw data values
Nutrient
DV% diff.
Sodium
1240mg
33mg
52%
Iron
4.58mg
0.59mg
50%
Folate
166µg
5µg
40%
Vitamin B1
0.424mg
0.013mg
34%
Manganese
1.015mg
0.304mg
31%
Starch
72.58g
30%
Vitamin B3
5.27mg
0.478mg
30%
Vitamin E
0.47mg
2.77mg
15%
Vitamin B2
0.332mg
0.148mg
14%
Protein
10.04g
3.33g
13%
Phosphorus
128mg
55mg
10%
Polyunsaturated fat
1.291g
0g
9%
Zinc
1.04mg
0.42mg
6%
Saturated fat
0.391g
1.667g
6%
Vitamin B5
0.322mg
0.06mg
5%
Carbs
80.39g
92.39g
4%
Vitamin B6
0.074mg
0.02mg
4%
Choline
29.5mg
5.1mg
4%
Potassium
223mg
105mg
3%
Selenium
4.4µg
2.6µg
3%
Fats
2.93g
1.67g
2%
Vitamin C
2.1mg
0.3mg
2%
Copper
0.156mg
0.134mg
2%
Vitamin K
2.8µg
0µg
2%
Monounsaturated fat
0.727g
0g
2%
Calories
384kcal
398kcal
1%
Magnesium
29mg
32mg
1%
Calcium
27mg
32mg
1%
Protein per 100 calories
2.6g
0.84g
N/A
Calories per 10 g protein
382kcal
1195kcal
N/A
Weight per 100 calories
26g
25g
N/A
Unsaturated / Saturated Fat ratio
5.2
0
N/A
Net carbs
76.99g
89.09g
N/A
Sugar
2.21g
44.97g
N/A
Fiber
3.4g
3.3g
0%
Vitamin B12
0µg
0.01µg
0%
Trans fat
0.004g
N/A
Tryptophan
0.097mg
0%
Threonine
0.25mg
0%
Isoleucine
0.407mg
0%
Leucine
0.757mg
0%
Lysine
0.257mg
0%
Methionine
0.177mg
0%
Phenylalanine
0.52mg
0%
Valine
0.48mg
0%
Histidine
0.22mg
0%
Fructose
0.31g
0%
Omega-3 - ALA
0.063g
N/A
Omega-6 - Gamma-linoleic acid
0.001g
N/A
Omega-6 - Linoleic acid
1.223g
N/A
Macronutrient Comparison
Macronutrient breakdown side-by-side comparison
4
10%
3%
80%
3%
4%
Protein:
10.04 g
Fats:
2.93 g
Carbs:
80.39 g
Water:
3.13 g
Other:
3.51 g
1
3%
2%
92%
2%
Protein:
3.33 g
Fats:
1.67 g
Carbs:
92.39 g
Water:
2.15 g
Other:
0.46 g
Contains
more
Protein Protein
+201.5%
Contains
more
Fats Fats
+75.4%
Contains
more
Water Water
+45.6%
Contains
more
Other Other
+663%
Contains
more
Carbs Carbs
+14.9%
Fat Type Comparison
Fat type breakdown side-by-side comparison
3
16%
30%
54%
Saturated fat:
Sat. Fat
0.391 g
Monounsaturated fat:
Mono. Fat
0.727 g
Polyunsaturated fat:
Poly. Fat
1.291 g
0
100%
Saturated fat:
Sat. Fat
1.667 g
Monounsaturated fat:
Mono. Fat
0 g
Polyunsaturated fat:
Poly. Fat
0 g
Contains
less
Sat. Fat Saturated fat
-76.5%
Contains
more
Mono. Fat Monounsaturated fat
+∞%
Contains
more
Poly. Fat Polyunsaturated fat
+∞%