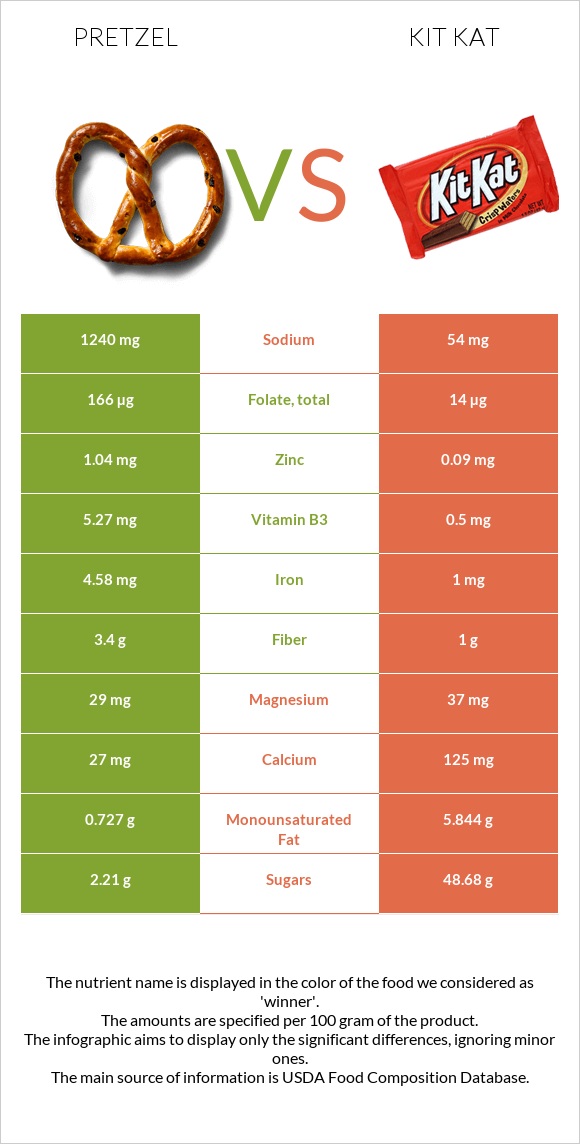
What are the main differences between pretzel and kit Kat? Pretzel is richer in iron, manganese, folate, vitamin B3, vitamin B1, and fiber, while kit Kat is higher in vitamin B12 and calcium. Kit Kat's daily need coverage for saturated fat is 88% higher. Kit Kat has 23 times less sodium than pretzel. Pretzel has 1240mg of sodium, while kit Kat has 54mg. Pretzel has a higher glycemic index (83) than kit Kat (50). We used Snacks, pretzels, hard, plain, salted and Candies, KIT KAT Wafer Bar types in this comparison.
Infographic
Mineral Comparison
Mineral comparison score is based on the number of minerals by which one or the other food is richer. The "coverage" charts below show how much of the daily needs can be covered by 300 grams of the food.
3
100 g
300 g
1 oz - 28.35g 10 twists - 60g
Magnesium
Magnesium
Calcium
Calcium
Potassium
Potassium
Iron
Iron
Copper
Copper
Zinc
Zinc
Phosphorus
Phosphorus
Sodium
Sodium
Manganese
Manganese
Selenium
Selenium
21%
8.1%
20%
172%
52%
28%
55%
162%
132%
24%
5
100 g
300 g
1 bar, miniature (.35 oz) - 10g 1 bar (1.5 oz) - 42g 1 bar (1.625 oz) - 46g 1 bar (2.8 oz) - 78g 1 bar (3.375 oz) - 96g
Magnesium
Magnesium
Calcium
Calcium
Potassium
Potassium
Iron
Iron
Copper
Copper
Zinc
Zinc
Phosphorus
Phosphorus
Sodium
Sodium
Manganese
Manganese
Selenium
Selenium
26%
38%
20%
38%
73%
2.5%
58%
7%
13%
27%
Vitamin Comparison
Vitamin comparison score is based on the number of vitamins by which one or the other food is richer. The "coverage" charts below show how much of the daily needs can be covered by 300 grams of the food.
7
100 g
300 g
1 oz - 28.35g 10 twists - 60g
Vitamin C
Vit. C
Vitamin D
Vit. D
Vitamin A
Vit. A
Vitamin E
Vit. E
Vitamin B1
Vit. B1
Vitamin B2
Vit. B2
Vitamin B3
Vit. B3
Vitamin B5
Vit. B5
Vitamin B6
Vit. B6
Vitamin B12
Vit. B12
Vitamin K
Vit. K
Folate
Folate
7%
0%
0%
9.4%
106%
77%
99%
19%
17%
0%
7%
125%
4
100 g
300 g
1 bar, miniature (.35 oz) - 10g 1 bar (1.5 oz) - 42g 1 bar (1.625 oz) - 46g 1 bar (2.8 oz) - 78g 1 bar (3.375 oz) - 96g
Vitamin C
Vit. C
Vitamin D
Vit. D
Vitamin A
Vit. A
Vitamin E
Vit. E
Vitamin B1
Vit. B1
Vitamin B2
Vit. B2
Vitamin B3
Vit. B3
Vitamin B5
Vit. B5
Vitamin B6
Vit. B6
Vitamin B12
Vit. B12
Vitamin K
Vit. K
Folate
Folate
0%
0%
8%
6.8%
29%
48%
9.4%
38%
4.6%
70%
13%
11%
All nutrients comparison - raw data values
Nutrient
DV% diff.
Saturated fat
0.391g
17.953g
80%
Sodium
1240mg
54mg
52%
Iron
4.58mg
1mg
45%
Manganese
1.015mg
0.1mg
40%
Folate
166µg
14µg
38%
Fats
2.93g
25.99g
35%
Vitamin B3
5.27mg
0.5mg
30%
Starch
72.58g
10.6g
26%
Vitamin B1
0.424mg
0.117mg
26%
Vitamin B12
0µg
0.56µg
23%
Monounsaturated fat
0.727g
5.844g
13%
Calcium
27mg
125mg
10%
Fiber
3.4g
1g
10%
Zinc
1.04mg
0.09mg
9%
Vitamin B2
0.332mg
0.21mg
9%
Calories
384kcal
518kcal
7%
Protein
10.04g
6.51g
7%
Copper
0.156mg
0.22mg
7%
Vitamin B5
0.322mg
0.64mg
6%
Carbs
80.39g
64.59g
5%
Cholesterol
0mg
11mg
4%
Vitamin B6
0.074mg
0.02mg
4%
Caffeine
0mg
14mg
4%
Vitamin A
0µg
24µg
3%
Polyunsaturated fat
1.291g
0.895g
3%
Vitamin C
2.1mg
0mg
2%
Magnesium
29mg
37mg
2%
Vitamin K
2.8µg
5.2µg
2%
Phosphorus
128mg
135mg
1%
Vitamin E
0.47mg
0.34mg
1%
Selenium
4.4µg
5µg
1%
Protein per 100 calories
2.6g
1.3g
N/A
Calories per 10 g protein
382kcal
796kcal
N/A
Weight per 100 calories
26g
19g
N/A
Unsaturated / Saturated Fat ratio
5.2
0.38
N/A
Net carbs
76.99g
63.59g
N/A
Potassium
223mg
231mg
0%
Sugar
2.21g
48.68g
N/A
Trans fat
0.004g
0.099g
N/A
Choline
29.5mg
31mg
0%
Tryptophan
0.097mg
0.09mg
0%
Threonine
0.25mg
0.19mg
0%
Isoleucine
0.407mg
0.28mg
0%
Leucine
0.757mg
0.52mg
0%
Lysine
0.257mg
0.28mg
0%
Methionine
0.177mg
0.16mg
0%
Phenylalanine
0.52mg
0.27mg
0%
Valine
0.48mg
0.36mg
0%
Histidine
0.22mg
0.11mg
0%
Fructose
0.31g
0.2g
0%
Omega-3 - ALA
0.063g
0.075g
N/A
Omega-6 - Gamma-linoleic acid
0.001g
0g
N/A
Omega-6 - Linoleic acid
1.223g
N/A
Macronutrient Comparison
Macronutrient breakdown side-by-side comparison
4
10%
3%
80%
3%
4%
Protein:
10.04 g
Fats:
2.93 g
Carbs:
80.39 g
Water:
3.13 g
Other:
3.51 g
1
7%
26%
65%
Protein:
6.51 g
Fats:
25.99 g
Carbs:
64.59 g
Water:
1.63 g
Other:
1.28 g
Contains
more
Protein Protein
+54.2%
Contains
more
Carbs Carbs
+24.5%
Contains
more
Water Water
+92%
Contains
more
Other Other
+174.2%
Contains
more
Fats Fats
+787%
Fat Type Comparison
Fat type breakdown side-by-side comparison
2
16%
30%
54%
Saturated fat:
Sat. Fat
0.391 g
Monounsaturated fat:
Mono. Fat
0.727 g
Polyunsaturated fat:
Poly. Fat
1.291 g
1
73%
24%
4%
Saturated fat:
Sat. Fat
17.953 g
Monounsaturated fat:
Mono. Fat
5.844 g
Polyunsaturated fat:
Poly. Fat
0.895 g
Contains
less
Sat. Fat Saturated fat
-97.8%
Contains
more
Poly. Fat Polyunsaturated fat
+44.2%
Contains
more
Mono. Fat Monounsaturated fat
+703.9%
Carbohydrate type comparison
Carbohydrate type breakdown side-by-side comparison
4
97%
Starch:
72.58 g
Sucrose:
0 g
Glucose:
0.69 g
Fructose:
0.31 g
Lactose:
0 g
Maltose:
1.11 g
Galactose:
0 g
2
18%
68%
14%
Starch:
10.6 g
Sucrose:
40.04 g
Glucose:
0.16 g
Fructose:
0.2 g
Lactose:
8.21 g
Maltose:
0.07 g
Galactose:
0 g
Contains
more
Starch Starch
+584.7%
Contains
more
Glucose Glucose
+331.3%
Contains
more
Fructose Fructose
+55%
Contains
more
Maltose Maltose
+1485.7%
Contains
more
Sucrose Sucrose
+∞%
Contains
more
Lactose Lactose
+∞%