Infographic
Mineral Comparison
Mineral comparison score is based on the number of minerals by which one or the other food is richer. The "coverage" charts below show how much of the daily needs can be covered by 300 grams of the food.
1
100 g
300 g
1 cup - 114g
Magnesium
Magnesium
Calcium
Calcium
Potassium
Potassium
Iron
Iron
Copper
Copper
Zinc
Zinc
Phosphorus
Phosphorus
Sodium
Sodium
Manganese
Manganese
Selenium
Selenium
6.4%
1.2%
3.1%
18%
2.7%
3.3%
11%
7.8%
49%
0%
8
100 g
300 g
1 cup shells - 105g 1 cup penne - 107g 1 cup rotini - 107g 1 cup farfalle - 107g 1 cup lasagne - 116g 1 cup elbows not packed - 120g 1 cup spaghetti not packed - 124g 1 cup elbows packed - 132g 1 cup spaghetti packed - 151g
Magnesium
Magnesium
Calcium
Calcium
Potassium
Potassium
Iron
Iron
Copper
Copper
Zinc
Zinc
Phosphorus
Phosphorus
Sodium
Sodium
Manganese
Manganese
Selenium
Selenium
13%
2.1%
3.9%
19%
33%
14%
25%
0.13%
42%
144%
Vitamin Comparison
Vitamin comparison score is based on the number of vitamins by which one or the other food is richer. The "coverage" charts below show how much of the daily needs can be covered by 300 grams of the food.
4
100 g
300 g
1 cup - 114g
Vitamin C
Vit. C
Vitamin D
Vit. D
Vitamin A
Vit. A
Vitamin E
Vit. E
Vitamin B1
Vit. B1
Vitamin B2
Vit. B2
Vitamin B3
Vit. B3
Vitamin B5
Vit. B5
Vitamin B6
Vit. B6
Vitamin B12
Vit. B12
Vitamin K
Vit. K
Folate
Folate
0%
0%
0%
0%
24%
6%
9.6%
14%
9.2%
0%
0%
5.3%
2
100 g
300 g
1 cup shells - 105g 1 cup penne - 107g 1 cup rotini - 107g 1 cup farfalle - 107g 1 cup lasagne - 116g 1 cup elbows not packed - 120g 1 cup spaghetti not packed - 124g 1 cup elbows packed - 132g 1 cup spaghetti packed - 151g
Vitamin C
Vit. C
Vitamin D
Vit. D
Vitamin A
Vit. A
Vitamin E
Vit. E
Vitamin B1
Vit. B1
Vitamin B2
Vit. B2
Vitamin B3
Vit. B3
Vitamin B5
Vit. B5
Vitamin B6
Vit. B6
Vitamin B12
Vit. B12
Vitamin K
Vit. K
Folate
Folate
0%
0%
0%
1.2%
5%
4.6%
7.5%
6.7%
11%
0%
0%
5.3%
All nutrients comparison - raw data values
Nutrient
DV% diff.
Selenium
26.4µg
48%
Starch
26.01g
11%
Copper
0.008mg
0.1mg
10%
Fiber
1.8g
7%
Vitamin B1
0.094mg
0.02mg
6%
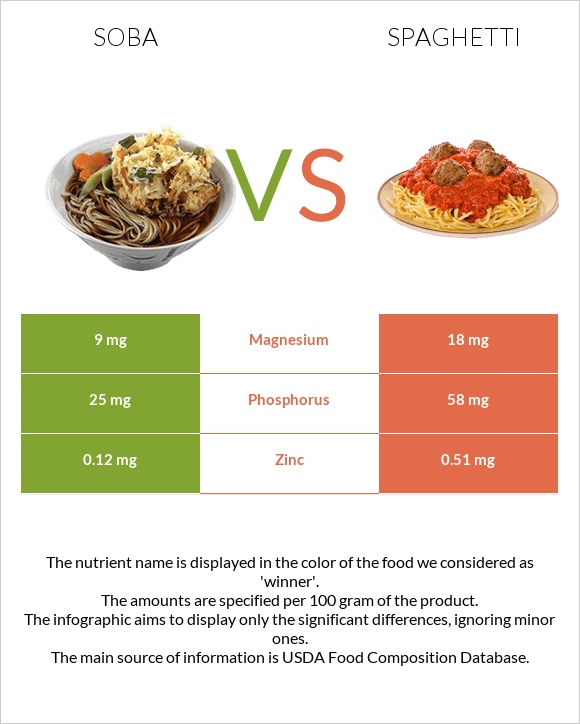
Phosphorus
25mg
58mg
5%
Zinc
0.12mg
0.51mg
4%
Calories
99kcal
158kcal
3%
Carbs
21.44g
30.86g
3%
Sodium
60mg
1mg
3%
Magnesium
9mg
18mg
2%
Manganese
0.374mg
0.322mg
2%
Vitamin B5
0.235mg
0.112mg
2%
Polyunsaturated fat
0.031g
0.326g
2%
Protein
5.06g
5.8g
1%
Fats
0.1g
0.93g
1%
Vitamin B3
0.51mg
0.4mg
1%
Vitamin B6
0.04mg
0.049mg
1%
Choline
6.4mg
1%
Saturated fat
0.019g
0.176g
1%
Protein per 100 calories
5.1g
3.7g
N/A
Calories per 10 g protein
196kcal
272kcal
N/A
Weight per 100 calories
101g
63g
N/A
Net carbs
21.44g
29.06g
N/A
Calcium
4mg
7mg
0%
Potassium
35mg
44mg
0%
Iron
0.48mg
0.5mg
0%
Sugar
0.56g
N/A
Vitamin E
0.06mg
0%
Vitamin B2
0.026mg
0.02mg
0%
Folate
7µg
7µg
0%
Monounsaturated fat
0.026g
0.131g
0%
Tryptophan
0.072mg
0.083mg
0%
Threonine
0.177mg
0.206mg
0%
Isoleucine
0.195mg
0.228mg
0%
Leucine
0.33mg
0.44mg
0%
Lysine
0.214mg
0.133mg
0%
Methionine
0.072mg
0.065mg
0%
Phenylalanine
0.217mg
0.297mg
0%
Valine
0.249mg
0.262mg
0%
Histidine
0.119mg
0.132mg
0%
Fructose
0.03g
0%
Omega-3 - ALA
0.024g
N/A
Macronutrient Comparison
Macronutrient breakdown side-by-side comparison
2
5%
21%
73%
Protein:
5.06 g
Fats:
0.1 g
Carbs:
21.44 g
Water:
73.01 g
Other:
0.39 g
3
6%
31%
62%
Protein:
5.8 g
Fats:
0.93 g
Carbs:
30.86 g
Water:
62.13 g
Other:
0.28 g
Contains
more
Water Water
+17.5%
Contains
more
Other Other
+39.3%
Contains
more
Protein Protein
+14.6%
Contains
more
Fats Fats
+830%
Contains
more
Carbs Carbs
+43.9%
Fat Type Comparison
Fat type breakdown side-by-side comparison
1
25%
34%
41%
Saturated fat:
Sat. Fat
0.019 g
Monounsaturated fat:
Mono. Fat
0.026 g
Polyunsaturated fat:
Poly. Fat
0.031 g
2
28%
21%
52%
Saturated fat:
Sat. Fat
0.176 g
Monounsaturated fat:
Mono. Fat
0.131 g
Polyunsaturated fat:
Poly. Fat
0.326 g
Contains
less
Sat. Fat Saturated fat
-89.2%
Contains
more
Mono. Fat Monounsaturated fat
+403.8%
Contains
more
Poly. Fat Polyunsaturated fat
+951.6%