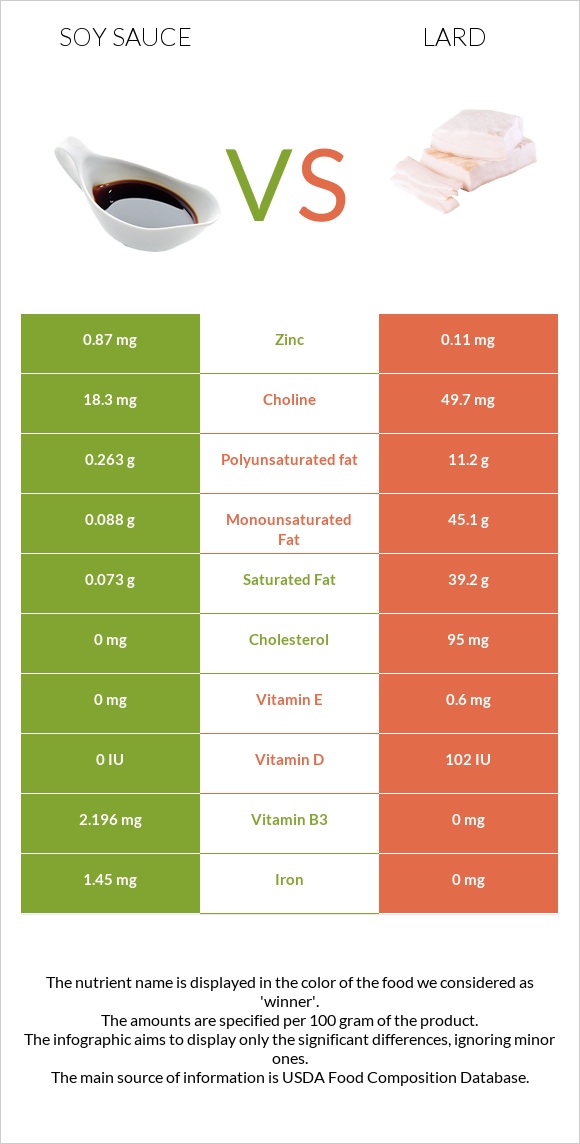
A recap on the differences between soy sauce and lard Soy sauce has more manganese, phosphorus, iron, magnesium, vitamin B3, and potassium; however, lard is higher in vitamin D*. Soy sauce covers your daily sodium needs 239% more than lard. Lard has less sodium. The glycemic index of soy sauce is higher. Food varieties used in this article are Soy sauce made from soy and wheat (shoyu) and Lard .
Infographic
Mineral Comparison
Mineral comparison score is based on the number of minerals by which one or the other food is richer. The "coverage" charts below show how much of the daily needs can be covered by 300 grams of the food.
9
100 g
300 g
1 tsp - 5.3g 1 individual packet - 8.9g 1 tbsp - 16g 1 cup - 255g
Magnesium
Magnesium
Calcium
Calcium
Potassium
Potassium
Iron
Iron
Copper
Copper
Zinc
Zinc
Phosphorus
Phosphorus
Sodium
Sodium
Manganese
Manganese
Selenium
Selenium
53%
9.9%
38%
54%
14%
24%
71%
716%
133%
2.7%
1
100 g
300 g
1 tbsp - 12.8g 1 cup - 205g
Magnesium
Magnesium
Calcium
Calcium
Potassium
Potassium
Iron
Iron
Copper
Copper
Zinc
Zinc
Phosphorus
Phosphorus
Sodium
Sodium
Manganese
Manganese
Selenium
Selenium
0%
0%
0%
0%
0%
3%
0%
0%
0%
1.1%
Vitamin Comparison
Vitamin comparison score is based on the number of vitamins by which one or the other food is richer. The "coverage" charts below show how much of the daily needs can be covered by 300 grams of the food.
6
100 g
300 g
1 tsp - 5.3g 1 individual packet - 8.9g 1 tbsp - 16g 1 cup - 255g
Vitamin C
Vit. C
Vitamin D
Vit. D
Vitamin A
Vit. A
Vitamin E
Vit. E
Vitamin B1
Vit. B1
Vitamin B2
Vit. B2
Vitamin B3
Vit. B3
Vitamin B5
Vit. B5
Vitamin B6
Vit. B6
Vitamin B12
Vit. B12
Vitamin K
Vit. K
Folate
Folate
0%
0%
0%
0%
8.3%
38%
41%
18%
34%
0%
0%
11%
2
100 g
300 g
1 tbsp - 12.8g 1 cup - 205g
Vitamin C
Vit. C
Vitamin D
Vit. D
Vitamin A
Vit. A
Vitamin E
Vit. E
Vitamin B1
Vit. B1
Vitamin B2
Vit. B2
Vitamin B3
Vit. B3
Vitamin B5
Vit. B5
Vitamin B6
Vit. B6
Vitamin B12
Vit. B12
Vitamin K
Vit. K
Folate
Folate
0%
38%
0%
12%
0%
0%
0%
0%
0%
0%
0%
0%
All nutrients comparison - raw data values
Nutrient
DV% diff.
Sodium
5493mg
0mg
239%
Saturated fat
0.073g
39.2g
178%
Fats
0.57g
100g
153%
Monounsaturated fat
0.088g
45.1g
113%
Polyunsaturated fat
0.263g
11.2g
73%
Manganese
1.018mg
0mg
44%
Calories
53kcal
902kcal
42%
Cholesterol
0mg
95mg
32%
Phosphorus
166mg
0mg
24%
Magnesium
74mg
0mg
18%
Iron
1.45mg
0mg
18%
Protein
8.14g
0g
16%
Vitamin B3
2.196mg
0mg
14%
Vitamin D*
0 IU
102 IU
13%
Vitamin D
0µg
2.5µg
13%
Potassium
435mg
0mg
13%
Vitamin B2
0.165mg
0mg
13%
Vitamin B6
0.148mg
0mg
11%
Zinc
0.87mg
0.11mg
7%
Vitamin B5
0.297mg
0mg
6%
Choline
18.3mg
49.7mg
6%
Copper
0.043mg
0mg
5%
Vitamin E
0mg
0.6mg
4%
Folate
14µg
0µg
4%
Calcium
33mg
0mg
3%
Fiber
0.8g
0g
3%
Vitamin B1
0.033mg
0mg
3%
Carbs
4.93g
0g
2%
Selenium
0.5µg
0.2µg
1%
Protein per 100 calories
15g
0g
N/A
Calories per 10 g protein
65kcal
N/A
Weight per 100 calories
189g
11g
N/A
Unsaturated / Saturated Fat ratio
4.8
1.4
N/A
Net carbs
4.13g
0g
N/A
Sugar
0.4g
0g
N/A
Tryptophan
0.096mg
0mg
0%
Threonine
0.271mg
0mg
0%
Isoleucine
0.318mg
0mg
0%
Leucine
0.537mg
0mg
0%
Lysine
0.381mg
0mg
0%
Methionine
0.097mg
0mg
0%
Phenylalanine
0.353mg
0mg
0%
Valine
0.332mg
0mg
0%
Histidine
0.174mg
0mg
0%
Macronutrient Comparison
Macronutrient breakdown side-by-side comparison
4
8%
5%
71%
15%
Protein:
8.14 g
Fats:
0.57 g
Carbs:
4.93 g
Water:
71.15 g
Other:
15.21 g
1
100%
Protein:
0 g
Fats:
100 g
Carbs:
0 g
Water:
0 g
Other:
0 g
Contains
more
Protein Protein
+∞%
Contains
more
Carbs Carbs
+∞%
Contains
more
Water Water
+∞%
Contains
more
Other Other
+∞%
Contains
more
Fats Fats
+17443.9%
Fat Type Comparison
Fat type breakdown side-by-side comparison
1
17%
21%
62%
Saturated fat:
Sat. Fat
0.073 g
Monounsaturated fat:
Mono. Fat
0.088 g
Polyunsaturated fat:
Poly. Fat
0.263 g
2
41%
47%
12%
Saturated fat:
Sat. Fat
39.2 g
Monounsaturated fat:
Mono. Fat
45.1 g
Polyunsaturated fat:
Poly. Fat
11.2 g
Contains
less
Sat. Fat Saturated fat
-99.8%
Contains
more
Mono. Fat Monounsaturated fat
+51150%
Contains
more
Poly. Fat Polyunsaturated fat
+4158.6%