Summary of differences between soy milk and olive oil Soy milk has more copper, manganese, selenium, vitamin B5, phosphorus, magnesium, and vitamin B6, while olive oil has more vitamin E and vitamin K. Olive oil covers your daily need for vitamin E, 95% more than soy milk. The amount of saturated fat in soy milk is lower. Olive oil has a lower glycemic index. The glycemic index of olive oil is 0, while the glycemic index of soy milk is 37. These are the specific foods used in this comparison Soymilk, original, and vanilla, unfortified and Oil, olive, salad or cooking .
Infographic
Mineral Comparison
Mineral comparison score is based on the number of minerals by which one or the other food is richer. The "coverage" charts below show how much of the daily needs can be covered by 300 grams of the food.
9
100 g
300 g
1 fl oz - 30.6g 1 cup - 243g
Magnesium
Magnesium
Calcium
Calcium
Potassium
Potassium
Iron
Iron
Copper
Copper
Zinc
Zinc
Phosphorus
Phosphorus
Sodium
Sodium
Manganese
Manganese
Selenium
Selenium
18%
7.5%
10%
24%
43%
3.3%
22%
6.7%
29%
26%
1
100 g
300 g
1 tsp - 4.5g 1 tbsp - 13.5g 1 cup - 216g
Magnesium
Magnesium
Calcium
Calcium
Potassium
Potassium
Iron
Iron
Copper
Copper
Zinc
Zinc
Phosphorus
Phosphorus
Sodium
Sodium
Manganese
Manganese
Selenium
Selenium
0%
0.3%
0.09%
21%
0%
0%
0%
0.26%
0%
0%
Vitamin Comparison
Vitamin comparison score is based on the number of vitamins by which one or the other food is richer. The "coverage" charts below show how much of the daily needs can be covered by 300 grams of the food.
6
100 g
300 g
1 fl oz - 30.6g 1 cup - 243g
Vitamin C
Vit. C
Vitamin D
Vit. D
Vitamin A
Vit. A
Vitamin E
Vit. E
Vitamin B1
Vit. B1
Vitamin B2
Vit. B2
Vitamin B3
Vit. B3
Vitamin B5
Vit. B5
Vitamin B6
Vit. B6
Vitamin B12
Vit. B12
Vitamin K
Vit. K
Folate
Folate
0%
0%
0%
2.2%
15%
16%
9.6%
22%
18%
0%
7.5%
14%
2
100 g
300 g
1 tsp - 4.5g 1 tbsp - 13.5g 1 cup - 216g
Vitamin C
Vit. C
Vitamin D
Vit. D
Vitamin A
Vit. A
Vitamin E
Vit. E
Vitamin B1
Vit. B1
Vitamin B2
Vit. B2
Vitamin B3
Vit. B3
Vitamin B5
Vit. B5
Vitamin B6
Vit. B6
Vitamin B12
Vit. B12
Vitamin K
Vit. K
Folate
Folate
0%
0%
0%
287%
0%
0%
0%
0%
0%
0%
151%
0%
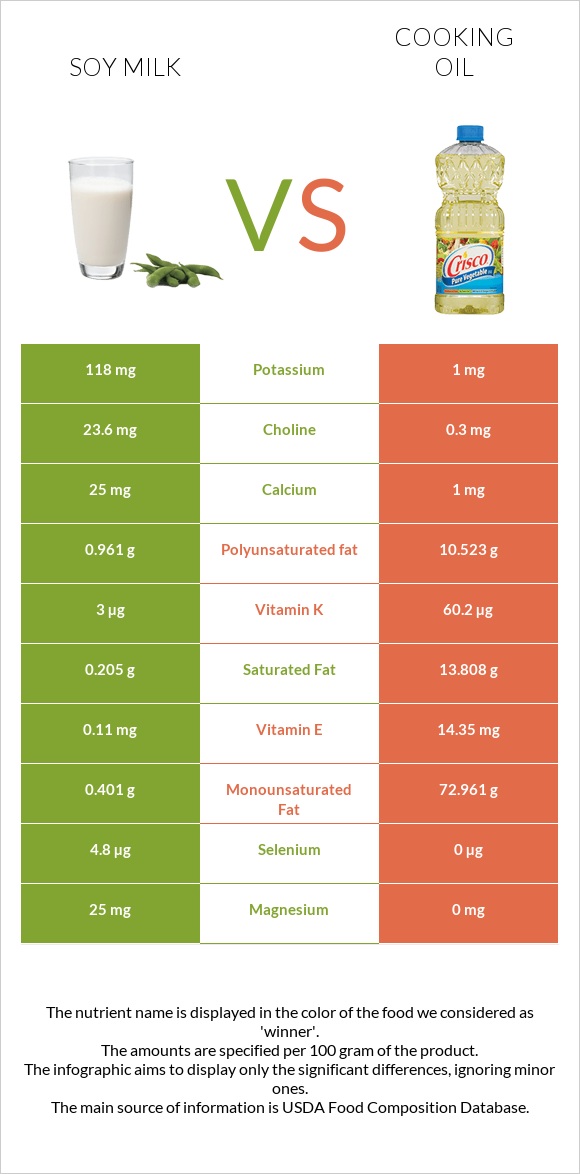
All nutrients comparison - raw data values
Nutrient
DV% diff.
Monounsaturated fat
0.401g
72.961g
181%
Fats
1.75g
100g
151%
Vitamin E
0.11mg
14.35mg
95%
Polyunsaturated fat
0.961g
10.523g
64%
Saturated fat
0.205g
13.808g
62%
Vitamin K
3µg
60.2µg
48%
Calories
54kcal
884kcal
42%
Copper
0.128mg
0mg
14%
Manganese
0.223mg
0mg
10%
Selenium
4.8µg
0µg
9%
Protein
3.27g
0g
7%
Phosphorus
52mg
0mg
7%
Vitamin B5
0.373mg
0mg
7%
Magnesium
25mg
0mg
6%
Vitamin B6
0.077mg
0mg
6%
Vitamin B1
0.06mg
0mg
5%
Vitamin B2
0.069mg
0mg
5%
Folate
18µg
0µg
5%
Choline
23.6mg
0.3mg
4%
Potassium
118mg
1mg
3%
Vitamin B3
0.513mg
0mg
3%
Carbs
6.28g
0g
2%
Calcium
25mg
1mg
2%
Fiber
0.6g
0g
2%
Sodium
51mg
2mg
2%
Iron
0.64mg
0.56mg
1%
Zinc
0.12mg
0mg
1%
Protein per 100 calories
6.1g
0g
N/A
Calories per 10 g protein
165kcal
N/A
Weight per 100 calories
185g
11g
N/A
Unsaturated / Saturated Fat ratio
6.6
6
N/A
Net carbs
5.68g
0g
N/A
Sugar
3.99g
0g
N/A
Tryptophan
0.038mg
0mg
0%
Threonine
0.108mg
0mg
0%
Isoleucine
0.114mg
0mg
0%
Leucine
0.186mg
0mg
0%
Lysine
0.131mg
0mg
0%
Methionine
0.027mg
0mg
0%
Phenylalanine
0.113mg
0mg
0%
Valine
0.117mg
0mg
0%
Histidine
0.061mg
0mg
0%
Macronutrient Comparison
Macronutrient breakdown side-by-side comparison
4
3%
2%
6%
88%
Protein:
3.27 g
Fats:
1.75 g
Carbs:
6.28 g
Water:
88.05 g
Other:
0.65 g
1
100%
Protein:
0 g
Fats:
100 g
Carbs:
0 g
Water:
0 g
Other:
0 g
Contains
more
Protein Protein
+∞%
Contains
more
Carbs Carbs
+∞%
Contains
more
Water Water
+∞%
Contains
more
Other Other
+∞%
Contains
more
Fats Fats
+5614.3%
Fat Type Comparison
Fat type breakdown side-by-side comparison
1
13%
26%
61%
Saturated fat:
Sat. Fat
0.205 g
Monounsaturated fat:
Mono. Fat
0.401 g
Polyunsaturated fat:
Poly. Fat
0.961 g
2
14%
75%
11%
Saturated fat:
Sat. Fat
13.808 g
Monounsaturated fat:
Mono. Fat
72.961 g
Polyunsaturated fat:
Poly. Fat
10.523 g
Contains
less
Sat. Fat Saturated fat
-98.5%
Contains
more
Mono. Fat Monounsaturated fat
+18094.8%
Contains
more
Poly. Fat Polyunsaturated fat
+995%