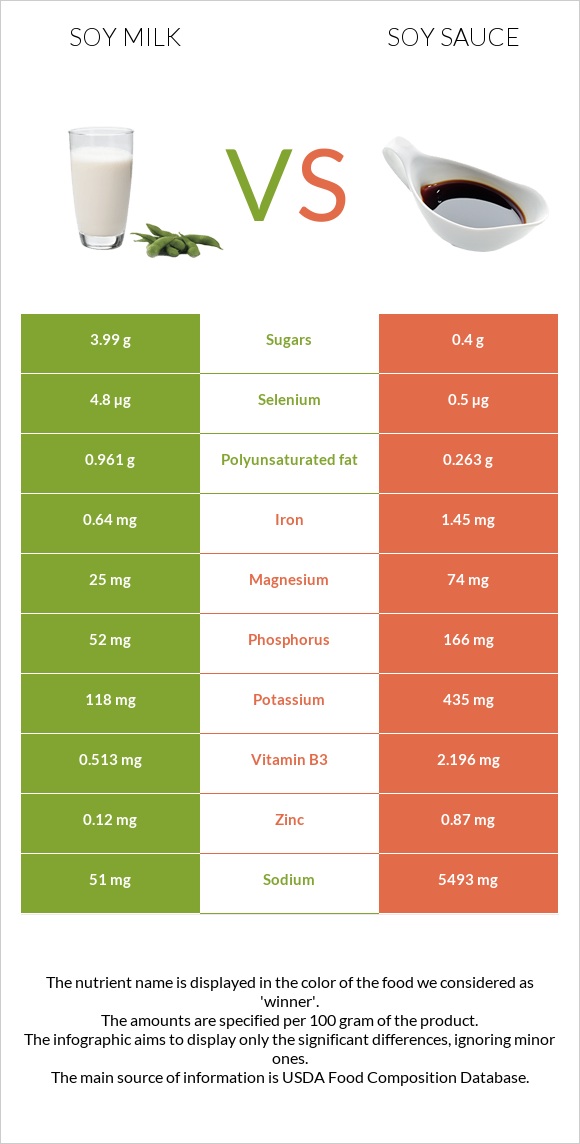
Summary of differences between soy milk and soy sauce Soy milk has more copper and selenium, while soy sauce has more manganese, phosphorus, magnesium, vitamin B3, iron, potassium, and vitamin B2. Soy sauce covers your daily need for sodium, 237% more than soy milk. Soy milk contains 10 times more selenium than soy sauce. While soy milk contains 4.8µg of selenium, soy sauce contains only 0.5µg. The amount of sodium in soy milk is lower. Soy sauce has a lower glycemic index. The glycemic index of soy sauce is 15, while the glycemic index of soy milk is 37. These are the specific foods used in this comparison Soymilk, original, and vanilla, unfortified and Soy sauce made from soy and wheat (shoyu) .
Infographic
Mineral Comparison
Mineral comparison score is based on the number of minerals by which one or the other food is richer. The "coverage" charts below show how much of the daily needs can be covered by 300 grams of the food.
3
100 g
300 g
1 fl oz - 30.6g 1 cup - 243g
Magnesium
Magnesium
Calcium
Calcium
Potassium
Potassium
Iron
Iron
Copper
Copper
Zinc
Zinc
Phosphorus
Phosphorus
Sodium
Sodium
Manganese
Manganese
Selenium
Selenium
18%
7.5%
10%
24%
43%
3.3%
22%
6.7%
29%
26%
7
100 g
300 g
1 tsp - 5.3g 1 individual packet - 8.9g 1 tbsp - 16g 1 cup - 255g
Magnesium
Magnesium
Calcium
Calcium
Potassium
Potassium
Iron
Iron
Copper
Copper
Zinc
Zinc
Phosphorus
Phosphorus
Sodium
Sodium
Manganese
Manganese
Selenium
Selenium
53%
9.9%
38%
54%
14%
24%
71%
716%
133%
2.7%
Vitamin Comparison
Vitamin comparison score is based on the number of vitamins by which one or the other food is richer. The "coverage" charts below show how much of the daily needs can be covered by 300 grams of the food.
5
100 g
300 g
1 fl oz - 30.6g 1 cup - 243g
Vitamin C
Vit. C
Vitamin D
Vit. D
Vitamin A
Vit. A
Vitamin E
Vit. E
Vitamin B1
Vit. B1
Vitamin B2
Vit. B2
Vitamin B3
Vit. B3
Vitamin B5
Vit. B5
Vitamin B6
Vit. B6
Vitamin B12
Vit. B12
Vitamin K
Vit. K
Folate
Folate
0%
0%
0%
2.2%
15%
16%
9.6%
22%
18%
0%
7.5%
14%
3
100 g
300 g
1 tsp - 5.3g 1 individual packet - 8.9g 1 tbsp - 16g 1 cup - 255g
Vitamin C
Vit. C
Vitamin D
Vit. D
Vitamin A
Vit. A
Vitamin E
Vit. E
Vitamin B1
Vit. B1
Vitamin B2
Vit. B2
Vitamin B3
Vit. B3
Vitamin B5
Vit. B5
Vitamin B6
Vit. B6
Vitamin B12
Vit. B12
Vitamin K
Vit. K
Folate
Folate
0%
0%
0%
0%
8.3%
38%
41%
18%
34%
0%
0%
11%
All nutrients comparison - raw data values
Nutrient
DV% diff.
Sodium
51mg
5493mg
237%
Manganese
0.223mg
1.018mg
35%
Phosphorus
52mg
166mg
16%
Magnesium
25mg
74mg
12%
Vitamin B3
0.513mg
2.196mg
11%
Protein
3.27g
8.14g
10%
Iron
0.64mg
1.45mg
10%
Potassium
118mg
435mg
9%
Copper
0.128mg
0.043mg
9%
Selenium
4.8µg
0.5µg
8%
Zinc
0.12mg
0.87mg
7%
Vitamin B2
0.069mg
0.165mg
7%
Vitamin B6
0.077mg
0.148mg
5%
Polyunsaturated fat
0.961g
0.263g
5%
Vitamin K
3µg
0µg
3%
Fats
1.75g
0.57g
2%
Vitamin B1
0.06mg
0.033mg
2%
Vitamin B5
0.373mg
0.297mg
2%
Calcium
25mg
33mg
1%
Fiber
0.6g
0.8g
1%
Vitamin E
0.11mg
0mg
1%
Folate
18µg
14µg
1%
Choline
23.6mg
18.3mg
1%
Saturated fat
0.205g
0.073g
1%
Monounsaturated fat
0.401g
0.088g
1%
Calories
54kcal
53kcal
0%
Protein per 100 calories
6.1g
15g
N/A
Calories per 10 g protein
165kcal
65kcal
N/A
Weight per 100 calories
185g
189g
N/A
Net carbs
5.68g
4.13g
N/A
Carbs
6.28g
4.93g
0%
Sugar
3.99g
0.4g
N/A
Tryptophan
0.038mg
0.096mg
0%
Threonine
0.108mg
0.271mg
0%
Isoleucine
0.114mg
0.318mg
0%
Leucine
0.186mg
0.537mg
0%
Lysine
0.131mg
0.381mg
0%
Methionine
0.027mg
0.097mg
0%
Phenylalanine
0.113mg
0.353mg
0%
Valine
0.117mg
0.332mg
0%
Histidine
0.061mg
0.174mg
0%
Macronutrient Comparison
Macronutrient breakdown side-by-side comparison
3
3%
2%
6%
88%
Protein:
3.27 g
Fats:
1.75 g
Carbs:
6.28 g
Water:
88.05 g
Other:
0.65 g
2
8%
5%
71%
15%
Protein:
8.14 g
Fats:
0.57 g
Carbs:
4.93 g
Water:
71.15 g
Other:
15.21 g
Contains
more
Fats Fats
+207%
Contains
more
Carbs Carbs
+27.4%
Contains
more
Water Water
+23.8%
Contains
more
Protein Protein
+148.9%
Contains
more
Other Other
+2240%
Fat Type Comparison
Fat type breakdown side-by-side comparison
2
13%
26%
61%
Saturated fat:
Sat. Fat
0.205 g
Monounsaturated fat:
Mono. Fat
0.401 g
Polyunsaturated fat:
Poly. Fat
0.961 g
1
17%
21%
62%
Saturated fat:
Sat. Fat
0.073 g
Monounsaturated fat:
Mono. Fat
0.088 g
Polyunsaturated fat:
Poly. Fat
0.263 g
Contains
more
Mono. Fat Monounsaturated fat
+355.7%
Contains
more
Poly. Fat Polyunsaturated fat
+265.4%
Contains
less
Sat. Fat Saturated fat
-64.4%