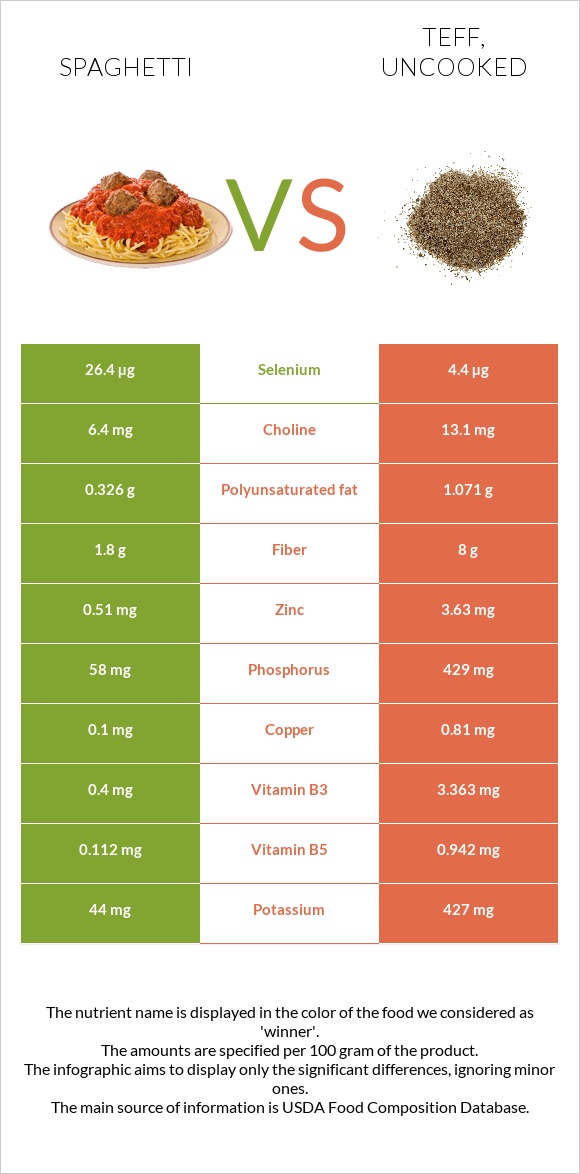
Summary of differences between spaghetti and teff Spaghetti has more selenium, while teff has more manganese, iron, copper, phosphorus, magnesium, vitamin B6, vitamin B1, zinc, and fiber. Teff covers your daily need for manganese, 388% more than spaghetti. Spaghetti contains 6 times more selenium than teff. While spaghetti contains 26.4µg of selenium, teff contains only 4.4µg. These are the specific foods used in this comparison Pasta, cooked, unenriched, without added salt and Teff, uncooked .
Infographic
Mineral Comparison
Mineral comparison score is based on the number of minerals by which one or the other food is richer. The "coverage" charts below show how much of the daily needs can be covered by 300 grams of the food.
2
100 g
300 g
1 cup shells - 105g 1 cup penne - 107g 1 cup rotini - 107g 1 cup farfalle - 107g 1 cup lasagne - 116g 1 cup elbows not packed - 120g 1 cup spaghetti not packed - 124g 1 cup elbows packed - 132g 1 cup spaghetti packed - 151g
Magnesium
Magnesium
Calcium
Calcium
Potassium
Potassium
Iron
Iron
Copper
Copper
Zinc
Zinc
Phosphorus
Phosphorus
Sodium
Sodium
Manganese
Manganese
Selenium
Selenium
13%
2.1%
3.9%
19%
33%
14%
25%
0.13%
42%
144%
8
100 g
300 g
1 cup - 193g
Magnesium
Magnesium
Calcium
Calcium
Potassium
Potassium
Iron
Iron
Copper
Copper
Zinc
Zinc
Phosphorus
Phosphorus
Sodium
Sodium
Manganese
Manganese
Selenium
Selenium
131%
54%
38%
286%
270%
99%
184%
1.6%
1205%
24%
Vitamin Comparison
Vitamin comparison score is based on the number of vitamins by which one or the other food is richer. The "coverage" charts below show how much of the daily needs can be covered by 300 grams of the food.
1
100 g
300 g
1 cup shells - 105g 1 cup penne - 107g 1 cup rotini - 107g 1 cup farfalle - 107g 1 cup lasagne - 116g 1 cup elbows not packed - 120g 1 cup spaghetti not packed - 124g 1 cup elbows packed - 132g 1 cup spaghetti packed - 151g
Vitamin C
Vit. C
Vitamin D
Vit. D
Vitamin A
Vit. A
Vitamin E
Vit. E
Vitamin B1
Vit. B1
Vitamin B2
Vit. B2
Vitamin B3
Vit. B3
Vitamin B5
Vit. B5
Vitamin B6
Vit. B6
Vitamin B12
Vit. B12
Vitamin K
Vit. K
Folate
Folate
0%
0%
0%
1.2%
5%
4.6%
7.5%
6.7%
11%
0%
0%
5.3%
7
100 g
300 g
1 cup - 193g
Vitamin C
Vit. C
Vitamin D
Vit. D
Vitamin A
Vit. A
Vitamin E
Vit. E
Vitamin B1
Vit. B1
Vitamin B2
Vit. B2
Vitamin B3
Vit. B3
Vitamin B5
Vit. B5
Vitamin B6
Vit. B6
Vitamin B12
Vit. B12
Vitamin K
Vit. K
Folate
Folate
0%
0%
0%
1.6%
98%
62%
63%
57%
111%
0%
4.8%
0%
All nutrients comparison - raw data values
Nutrient
DV% diff.
Manganese
0.322mg
9.24mg
388%
Iron
0.5mg
7.63mg
89%
Copper
0.1mg
0.81mg
79%
Phosphorus
58mg
429mg
53%
Magnesium
18mg
184mg
40%
Selenium
26.4µg
4.4µg
40%
Vitamin B6
0.049mg
0.482mg
33%
Vitamin B1
0.02mg
0.39mg
31%
Zinc
0.51mg
3.63mg
28%
Fiber
1.8g
8g
25%
Vitamin B2
0.02mg
0.27mg
19%
Vitamin B3
0.4mg
3.363mg
19%
Calcium
7mg
180mg
17%
Vitamin B5
0.112mg
0.942mg
17%
Protein
5.8g
13.3g
15%
Carbs
30.86g
73.13g
14%
Potassium
44mg
427mg
11%
Calories
158kcal
367kcal
10%
Polyunsaturated fat
0.326g
1.071g
5%
Starch
26.01g
36.56g
4%
Fats
0.93g
2.38g
2%
Vitamin K
0µg
1.9µg
2%
Folate
7µg
2%
Choline
6.4mg
13.1mg
1%
Saturated fat
0.176g
0.449g
1%
Monounsaturated fat
0.131g
0.589g
1%
Fructose
0.03g
0.47g
1%
Protein per 100 calories
3.7g
3.6g
N/A
Calories per 10 g protein
272kcal
276kcal
N/A
Weight per 100 calories
63g
27g
N/A
Unsaturated / Saturated Fat ratio
2.6
3.7
N/A
Net carbs
29.06g
65.13g
N/A
Sugar
0.56g
1.84g
N/A
Sodium
1mg
12mg
0%
Vitamin E
0.06mg
0.08mg
0%
Tryptophan
0.083mg
0.139mg
0%
Threonine
0.206mg
0.51mg
0%
Isoleucine
0.228mg
0.501mg
0%
Leucine
0.44mg
1.068mg
0%
Lysine
0.133mg
0.376mg
0%
Methionine
0.065mg
0.428mg
0%
Phenylalanine
0.297mg
0.698mg
0%
Valine
0.262mg
0.686mg
0%
Histidine
0.132mg
0.301mg
0%
Omega-3 - ALA
0.024g
0.135g
N/A
Macronutrient Comparison
Macronutrient breakdown side-by-side comparison
1
6%
31%
62%
Protein:
5.8 g
Fats:
0.93 g
Carbs:
30.86 g
Water:
62.13 g
Other:
0.28 g
4
13%
2%
73%
9%
2%
Protein:
13.3 g
Fats:
2.38 g
Carbs:
73.13 g
Water:
8.82 g
Other:
2.37 g
Contains
more
Water Water
+604.4%
Contains
more
Protein Protein
+129.3%
Contains
more
Fats Fats
+155.9%
Contains
more
Carbs Carbs
+137%
Contains
more
Other Other
+746.4%
Fat Type Comparison
Fat type breakdown side-by-side comparison
1
28%
21%
52%
Saturated fat:
Sat. Fat
0.176 g
Monounsaturated fat:
Mono. Fat
0.131 g
Polyunsaturated fat:
Poly. Fat
0.326 g
2
21%
28%
51%
Saturated fat:
Sat. Fat
0.449 g
Monounsaturated fat:
Mono. Fat
0.589 g
Polyunsaturated fat:
Poly. Fat
1.071 g
Contains
less
Sat. Fat Saturated fat
-60.8%
Contains
more
Mono. Fat Monounsaturated fat
+349.6%
Contains
more
Poly. Fat Polyunsaturated fat
+228.5%
Carbohydrate type comparison
Carbohydrate type breakdown side-by-side comparison
1
98%
Starch:
26.01 g
Sucrose:
0.09 g
Glucose:
0.04 g
Fructose:
0.03 g
Lactose:
0 g
Maltose:
0.4 g
Galactose:
0 g
4
95%
2%
Starch:
36.56 g
Sucrose:
0.62 g
Glucose:
0.73 g
Fructose:
0.47 g
Lactose:
0 g
Maltose:
0.01 g
Galactose:
0 g
Contains
more
Maltose Maltose
+3900%
Contains
more
Starch Starch
+40.6%
Contains
more
Sucrose Sucrose
+588.9%
Contains
more
Glucose Glucose
+1725%
Contains
more
Fructose Fructose
+1466.7%
~equal in
Lactose
~0g
~equal in
Galactose
~0g