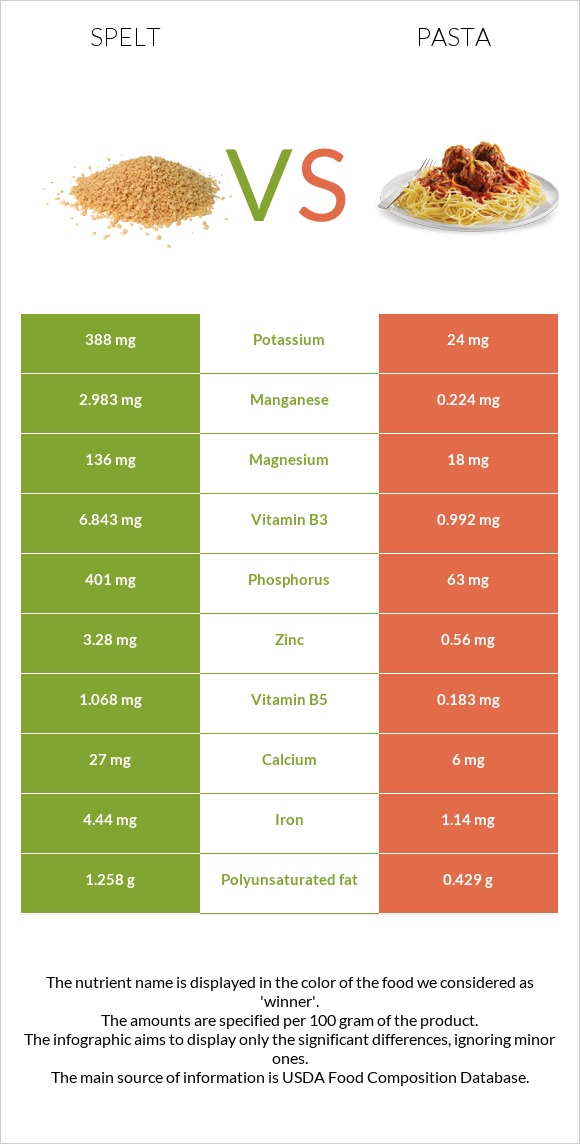
The main differences between spelt and pasta Pasta contains less manganese, phosphorus, copper, iron, vitamin B3, magnesium, zinc, vitamin B5, vitamin B6, and vitamin B1 than spelt. Daily need coverage for manganese for spelt is 120% higher. Pasta has 8 times less magnesium than spelt. Spelt has 136mg of magnesium, while pasta has 18mg. Spelt has a higher glycemic index than pasta. Food types used in this article are Spelt, uncooked and Pasta, fresh-refrigerated, plain, cooked .
Infographic
Mineral Comparison
Mineral comparison score is based on the number of minerals by which one or the other food is richer. The "coverage" charts below show how much of the daily needs can be covered by 300 grams of the food.
9
100 g
300 g
1 cup - 174g
Magnesium
Magnesium
Calcium
Calcium
Potassium
Potassium
Iron
Iron
Copper
Copper
Zinc
Zinc
Phosphorus
Phosphorus
Sodium
Sodium
Manganese
Manganese
Selenium
Selenium
97%
8.1%
34%
167%
170%
89%
172%
1%
389%
64%
1
100 g
300 g
2 oz - 128g
Magnesium
Magnesium
Calcium
Calcium
Potassium
Potassium
Iron
Iron
Copper
Copper
Zinc
Zinc
Phosphorus
Phosphorus
Sodium
Sodium
Manganese
Manganese
Selenium
Selenium
13%
1.8%
2.1%
43%
31%
15%
27%
0.78%
29%
0%
Vitamin Comparison
Vitamin comparison score is based on the number of vitamins by which one or the other food is richer. The "coverage" charts below show how much of the daily needs can be covered by 300 grams of the food.
6
100 g
300 g
1 cup - 174g
Vitamin C
Vit. C
Vitamin D
Vit. D
Vitamin A
Vit. A
Vitamin E
Vit. E
Vitamin B1
Vit. B1
Vitamin B2
Vit. B2
Vitamin B3
Vit. B3
Vitamin B5
Vit. B5
Vitamin B6
Vit. B6
Vitamin B12
Vit. B12
Vitamin K
Vit. K
Folate
Folate
0%
0%
0%
16%
91%
26%
128%
64%
53%
0%
9%
34%
4
100 g
300 g
2 oz - 128g
Vitamin C
Vit. C
Vitamin D
Vit. D
Vitamin A
Vit. A
Vitamin E
Vit. E
Vitamin B1
Vit. B1
Vitamin B2
Vit. B2
Vitamin B3
Vit. B3
Vitamin B5
Vit. B5
Vitamin B6
Vit. B6
Vitamin B12
Vit. B12
Vitamin K
Vit. K
Folate
Folate
0%
0%
2%
0%
52%
35%
19%
11%
7.8%
18%
0%
48%
All nutrients comparison - raw data values
Nutrient
DV% diff.
Manganese
2.983mg
0.224mg
120%
Phosphorus
401mg
63mg
48%
Copper
0.511mg
0.093mg
46%
Fiber
10.7g
43%
Iron
4.44mg
1.14mg
41%
Vitamin B3
6.843mg
0.992mg
37%
Magnesium
136mg
18mg
28%
Zinc
3.28mg
0.56mg
25%
Starch
53.92g
22%
Selenium
11.7µg
21%
Protein
14.57g
5.15g
19%
Vitamin B5
1.068mg
0.183mg
18%
Carbs
70.19g
24.93g
15%
Vitamin B6
0.23mg
0.034mg
15%
Vitamin B1
0.364mg
0.209mg
13%
Cholesterol
0mg
33mg
11%
Potassium
388mg
24mg
11%
Calories
338kcal
131kcal
10%
Vitamin B12
0µg
0.14µg
6%
Polyunsaturated fat
1.258g
0.429g
6%
Vitamin E
0.79mg
5%
Folate
45µg
64µg
5%
Vitamin B2
0.113mg
0.15mg
3%
Vitamin K
3.6µg
3%
Fats
2.43g
1.05g
2%
Calcium
27mg
6mg
2%
Vitamin A
0µg
6µg
1%
Saturated fat
0.406g
0.15g
1%
Monounsaturated fat
0.445g
0.124g
1%
Protein per 100 calories
4.3g
3.9g
N/A
Calories per 10 g protein
232kcal
254kcal
N/A
Weight per 100 calories
30g
76g
N/A
Unsaturated / Saturated Fat ratio
4.2
3.7
N/A
Net carbs
59.49g
24.93g
N/A
Sugar
6.82g
N/A
Sodium
8mg
6mg
0%
Tryptophan
0.132mg
0.065mg
0%
Threonine
0.443mg
0.134mg
0%
Isoleucine
0.552mg
0.197mg
0%
Leucine
1.07mg
0.348mg
0%
Lysine
0.409mg
0.097mg
0%
Methionine
0.258mg
0.079mg
0%
Phenylalanine
0.737mg
0.247mg
0%
Valine
0.681mg
0.217mg
0%
Histidine
0.36mg
0.103mg
0%
Fructose
0.24g
0%
Omega-3 - ALA
0.065g
N/A
Macronutrient Comparison
Macronutrient breakdown side-by-side comparison
4
15%
2%
70%
11%
2%
Protein:
14.57 g
Fats:
2.43 g
Carbs:
70.19 g
Water:
11.02 g
Other:
1.79 g
1
5%
25%
69%
Protein:
5.15 g
Fats:
1.05 g
Carbs:
24.93 g
Water:
68.56 g
Other:
0.31 g
Contains
more
Protein Protein
+182.9%
Contains
more
Fats Fats
+131.4%
Contains
more
Carbs Carbs
+181.5%
Contains
more
Other Other
+477.4%
Contains
more
Water Water
+522.1%
Fat Type Comparison
Fat type breakdown side-by-side comparison
2
19%
21%
60%
Saturated fat:
Sat. Fat
0.406 g
Monounsaturated fat:
Mono. Fat
0.445 g
Polyunsaturated fat:
Poly. Fat
1.258 g
1
21%
18%
61%
Saturated fat:
Sat. Fat
0.15 g
Monounsaturated fat:
Mono. Fat
0.124 g
Polyunsaturated fat:
Poly. Fat
0.429 g
Contains
more
Mono. Fat Monounsaturated fat
+258.9%
Contains
more
Poly. Fat Polyunsaturated fat
+193.2%
Contains
less
Sat. Fat Saturated fat
-63.1%