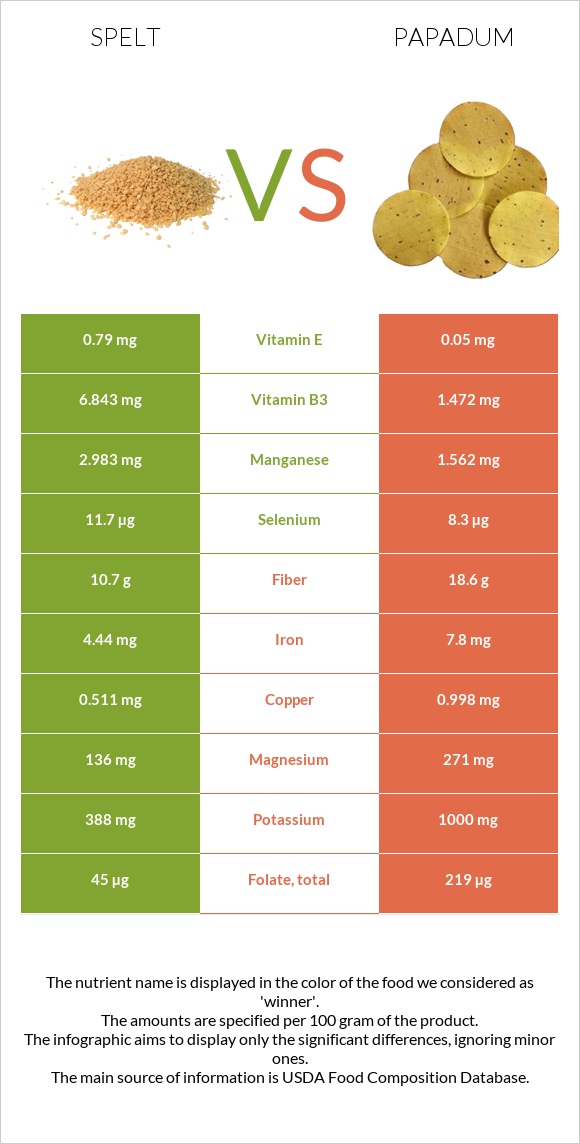
Differences between spelt and papadum Papadum is higher than spelt in copper, iron, fiber, magnesium, folate, phosphorus, potassium, manganese, and zinc. Papadum's daily need coverage for copper is 87% higher. Spelt has less sodium. Papadum has a lower glycemic index (46) than spelt (63). The food types used in this comparison are Spelt, cooked and Papad .
Infographic
Mineral Comparison
Mineral comparison score is based on the number of minerals by which one or the other food is richer. The "coverage" charts below show how much of the daily needs can be covered by 300 grams of the food.
1
100 g
300 g
1 cup - 194g
Magnesium
Magnesium
Calcium
Calcium
Potassium
Potassium
Iron
Iron
Copper
Copper
Zinc
Zinc
Phosphorus
Phosphorus
Sodium
Sodium
Manganese
Manganese
Selenium
Selenium
35%
3%
13%
63%
72%
34%
64%
0.65%
142%
22%
9
100 g
300 g
Magnesium
Magnesium
Calcium
Calcium
Potassium
Potassium
Iron
Iron
Copper
Copper
Zinc
Zinc
Phosphorus
Phosphorus
Sodium
Sodium
Manganese
Manganese
Selenium
Selenium
194%
43%
88%
293%
333%
93%
165%
228%
204%
45%
Vitamin Comparison
Vitamin comparison score is based on the number of vitamins by which one or the other food is richer. The "coverage" charts below show how much of the daily needs can be covered by 300 grams of the food.
2
100 g
300 g
1 cup - 194g
Vitamin C
Vit. C
Vitamin D
Vit. D
Vitamin A
Vit. A
Vitamin E
Vit. E
Vitamin B1
Vit. B1
Vitamin B2
Vit. B2
Vitamin B3
Vit. B3
Vitamin B5
Vit. B5
Vitamin B6
Vit. B6
Vitamin B12
Vit. B12
Vitamin K
Vit. K
Folate
Folate
0%
0%
0%
5.2%
26%
6.9%
48%
0%
18%
0%
0%
9.8%
7
100 g
300 g
Vitamin C
Vit. C
Vitamin D
Vit. D
Vitamin A
Vit. A
Vitamin E
Vit. E
Vitamin B1
Vit. B1
Vitamin B2
Vit. B2
Vitamin B3
Vit. B3
Vitamin B5
Vit. B5
Vitamin B6
Vit. B6
Vitamin B12
Vit. B12
Vitamin K
Vit. K
Folate
Folate
0%
0%
4.3%
1%
69%
60%
28%
55%
66%
0%
1%
164%
All nutrients comparison - raw data values
Nutrient
DV% diff.
Copper
0.215mg
0.998mg
87%
Iron
1.67mg
7.8mg
77%
Sodium
5mg
1745mg
76%
Fiber
3.9g
18.6g
59%
Magnesium
49mg
271mg
53%
Folate
13µg
219µg
52%
Protein
5.5g
25.56g
40%
Phosphorus
150mg
385mg
34%
Potassium
143mg
1000mg
25%
Zinc
1.25mg
3.4mg
20%
Manganese
1.091mg
1.562mg
20%
Vitamin B2
0.03mg
0.258mg
18%
Vitamin B5
0.917mg
18%
Vitamin B6
0.08mg
0.285mg
16%
Vitamin B1
0.103mg
0.277mg
15%
Calcium
10mg
143mg
13%
Calories
127kcal
371kcal
12%
Carbs
26.44g
59.87g
11%
Starch
19.57g
8%
Selenium
4µg
8.3µg
8%
Polyunsaturated fat
1.148g
8%
Vitamin B3
2.57mg
1.472mg
7%
Saturated fat
1.084g
5%
Fats
0.85g
3.25g
4%
Cholesterol
0mg
4mg
1%
Vitamin A
0µg
13µg
1%
Vitamin E
0.26mg
0.05mg
1%
Monounsaturated fat
0.532g
1%
Protein per 100 calories
4.3g
6.9g
N/A
Calories per 10 g protein
231kcal
145kcal
N/A
Weight per 100 calories
79g
27g
N/A
Unsaturated / Saturated Fat ratio
1.5
N/A
Net carbs
22.54g
41.27g
N/A
Vitamin K
0.4µg
0%
Choline
0.4mg
0%
Tryptophan
0.266mg
0%
Threonine
0.886mg
0%
Isoleucine
1.303mg
0%
Leucine
2.115mg
0%
Lysine
1.695mg
0%
Methionine
0.372mg
0%
Phenylalanine
1.491mg
0%
Valine
1.434mg
0%
Histidine
0.715mg
0%
Macronutrient Comparison
Macronutrient breakdown side-by-side comparison
1
6%
26%
67%
Protein:
5.5 g
Fats:
0.85 g
Carbs:
26.44 g
Water:
66.56 g
Other:
0.65 g
4
26%
3%
60%
3%
8%
Protein:
25.56 g
Fats:
3.25 g
Carbs:
59.87 g
Water:
3.49 g
Other:
7.83 g
Contains
more
Water Water
+1807.2%
Contains
more
Protein Protein
+364.7%
Contains
more
Fats Fats
+282.4%
Contains
more
Carbs Carbs
+126.4%
Contains
more
Other Other
+1104.6%