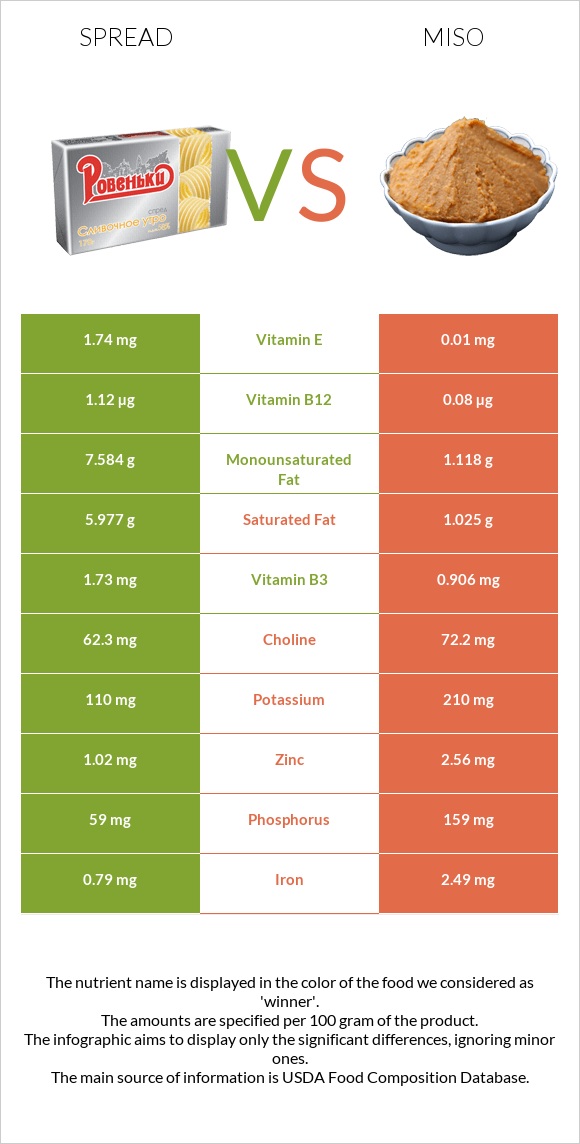
What are the differences between spread and miso? Spread is higher in vitamin A, vitamin E, monounsaturated fat, and polyunsaturated fat, yet miso is higher in phosphorus, fiber, vitamin K, and potassium. Miso's daily need coverage for sodium is 129% more. Spread has 170 times more vitamin E than miso. While spread has 1.7mg of vitamin E, miso has only 0.01mg. The amount of saturated fat in miso is lower. The glycemic index of spread is lower. We used Margarine-like spread, SMART BEAT Super Light without saturated fat and Miso types in this article.
Infographic
Mineral Comparison
Mineral comparison score is based on the number of minerals by which one or the other food is richer. The "coverage" charts below show how much of the daily needs can be covered by 300 grams of the food.
1
100 g
300 g
1 tablespoon - 14g
Magnesium
Magnesium
Calcium
Calcium
Potassium
Potassium
Iron
Iron
Copper
Copper
Zinc
Zinc
Phosphorus
Phosphorus
Sodium
Sodium
Manganese
Manganese
Selenium
Selenium
0%
0%
1.1%
0%
0%
0%
0%
98%
0%
0%
9
100 g
300 g
1 tbsp - 17g 1 cup - 275g
Magnesium
Magnesium
Calcium
Calcium
Potassium
Potassium
Iron
Iron
Copper
Copper
Zinc
Zinc
Phosphorus
Phosphorus
Sodium
Sodium
Manganese
Manganese
Selenium
Selenium
34%
17%
19%
93%
140%
70%
68%
486%
112%
38%
Vitamin Comparison
Vitamin comparison score is based on the number of vitamins by which one or the other food is richer. The "coverage" charts below show how much of the daily needs can be covered by 300 grams of the food.
1
100 g
300 g
1 tablespoon - 14g
Vitamin C
Vit. C
Vitamin D
Vit. D
Vitamin A
Vit. A
Vitamin E
Vit. E
Vitamin B1
Vit. B1
Vitamin B2
Vit. B2
Vitamin B3
Vit. B3
Vitamin B5
Vit. B5
Vitamin B6
Vit. B6
Vitamin B12
Vit. B12
Vitamin K
Vit. K
Folate
Folate
0%
0%
0%
34%
0%
0%
0%
0%
0%
0%
31%
0%
9
100 g
300 g
1 tbsp - 17g 1 cup - 275g
Vitamin C
Vit. C
Vitamin D
Vit. D
Vitamin A
Vit. A
Vitamin E
Vit. E
Vitamin B1
Vit. B1
Vitamin B2
Vit. B2
Vitamin B3
Vit. B3
Vitamin B5
Vit. B5
Vitamin B6
Vit. B6
Vitamin B12
Vit. B12
Vitamin K
Vit. K
Folate
Folate
0%
0%
1.3%
0.2%
25%
54%
17%
20%
46%
10%
73%
14%
All nutrients comparison - raw data values
Nutrient
DV% diff.
Sodium
755mg
3728mg
129%
Copper
0.42mg
47%
Manganese
0.859mg
37%
Iron
2.49mg
31%
Protein
0g
12.79g
26%
Zinc
2.56mg
23%
Phosphorus
0mg
159mg
23%
Fiber
0g
5.4g
22%
Vitamin B2
0.233mg
18%
Fats
17.1g
6.01g
17%
Monounsaturated fat
7.6g
1.118g
16%
Vitamin B6
0.199mg
15%
Vitamin K
12.3µg
29.3µg
14%
Selenium
7µg
13%
Choline
72.2mg
13%
Magnesium
48mg
11%
Vitamin E
1.7mg
0.01mg
11%
Carbs
0g
25.37g
8%
Vitamin B1
0.098mg
8%
Fructose
6g
8%
Vitamin B5
0.337mg
7%
Polyunsaturated fat
3.98g
2.884g
7%
Calcium
57mg
6%
Potassium
12mg
210mg
6%
Vitamin B3
0.906mg
6%
Folate
19µg
5%
Saturated fat
2.22g
1.025g
5%
Vitamin B12
0.08µg
3%
Calories
158kcal
198kcal
2%
Protein per 100 calories
0g
6.5g
N/A
Calories per 10 g protein
155kcal
N/A
Weight per 100 calories
63g
51g
N/A
Unsaturated / Saturated Fat ratio
5.2
3.9
N/A
Net carbs
0g
19.97g
N/A
Sugar
0g
6.2g
N/A
Vitamin A
4µg
0%
Trans fat
2.45g
0g
N/A
Tryptophan
0.155mg
0%
Threonine
0.479mg
0%
Isoleucine
0.508mg
0%
Leucine
0.82mg
0%
Lysine
0.478mg
0%
Methionine
0.129mg
0%
Phenylalanine
0.486mg
0%
Valine
0.547mg
0%
Histidine
0.243mg
0%
Macronutrient Comparison
Macronutrient breakdown side-by-side comparison
2
17%
81%
2%
Protein:
0 g
Fats:
17.1 g
Carbs:
0 g
Water:
80.83 g
Other:
2.07 g
3
13%
6%
25%
43%
13%
Protein:
12.79 g
Fats:
6.01 g
Carbs:
25.37 g
Water:
43.02 g
Other:
12.81 g
Contains
more
Fats Fats
+184.5%
Contains
more
Water Water
+87.9%
Contains
more
Protein Protein
+∞%
Contains
more
Carbs Carbs
+∞%
Contains
more
Other Other
+518.8%
Fat Type Comparison
Fat type breakdown side-by-side comparison
2
16%
55%
29%
Saturated fat:
Sat. Fat
2.22 g
Monounsaturated fat:
Mono. Fat
7.6 g
Polyunsaturated fat:
Poly. Fat
3.98 g
1
20%
22%
57%
Saturated fat:
Sat. Fat
1.025 g
Monounsaturated fat:
Mono. Fat
1.118 g
Polyunsaturated fat:
Poly. Fat
2.884 g
Contains
more
Mono. Fat Monounsaturated fat
+579.8%
Contains
more
Poly. Fat Polyunsaturated fat
+38%
Contains
less
Sat. Fat Saturated fat
-53.8%