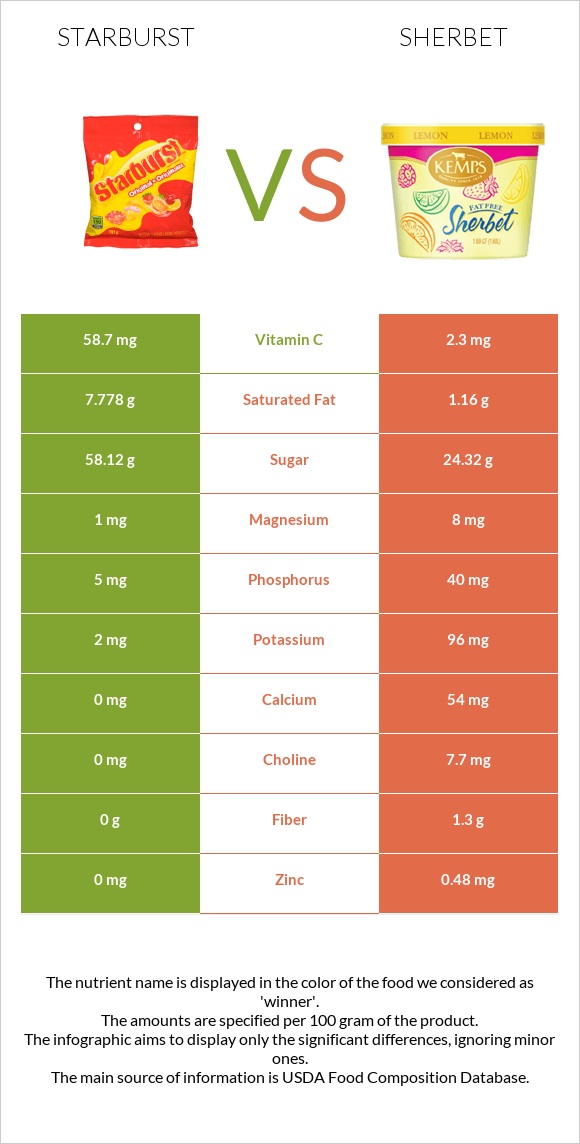
Summary of differences between starburst and sherbet Starburst has more vitamin C; however, sherbet is higher in vitamin B2, vitamin B12, calcium, fiber, and phosphorus. Starburst covers your daily need for vitamin C, 63% more than sherbet. Starburst has 7 times more saturated fat than sherbet. While starburst has 7.778g of saturated fat, sherbet has only 1.16g. These are the specific foods used in this comparison Candies, MARS SNACKFOOD US, STARBURST Fruit Chews, Original fruits and Sherbet, orange .
Infographic
Mineral Comparison
Mineral comparison score is based on the number of minerals by which one or the other food is richer. The "coverage" charts below show how much of the daily needs can be covered by 300 grams of the food.
2
100 g
300 g
1 piece - 5g 1 serving fun size (8 chews) - 40g 1 serving 2.07 oz pack - 59g
Magnesium
Magnesium
Calcium
Calcium
Potassium
Potassium
Iron
Iron
Copper
Copper
Zinc
Zinc
Phosphorus
Phosphorus
Sodium
Sodium
Manganese
Manganese
Selenium
Selenium
0.71%
0%
0.18%
0.38%
4%
0%
2.1%
0.26%
2%
4.4%
8
100 g
300 g
1 bar (2.75 fl oz) - 66g 0.5 cup (4 fl oz) - 74g
Magnesium
Magnesium
Calcium
Calcium
Potassium
Potassium
Iron
Iron
Copper
Copper
Zinc
Zinc
Phosphorus
Phosphorus
Sodium
Sodium
Manganese
Manganese
Selenium
Selenium
5.7%
16%
8.5%
5.3%
9.3%
13%
17%
6%
1.4%
8.2%
Vitamin Comparison
Vitamin comparison score is based on the number of vitamins by which one or the other food is richer. The "coverage" charts below show how much of the daily needs can be covered by 300 grams of the food.
3
100 g
300 g
1 piece - 5g 1 serving fun size (8 chews) - 40g 1 serving 2.07 oz pack - 59g
Vitamin C
Vit. C
Vitamin D
Vit. D
Vitamin A
Vit. A
Vitamin E
Vit. E
Vitamin B1
Vit. B1
Vitamin B2
Vit. B2
Vitamin B3
Vit. B3
Vitamin B5
Vit. B5
Vitamin B6
Vit. B6
Vitamin B12
Vit. B12
Vitamin K
Vit. K
Folate
Folate
196%
0%
0%
6.6%
0.25%
0.46%
0.09%
2.1%
0%
0%
5.3%
0.75%
8
100 g
300 g
1 bar (2.75 fl oz) - 66g 0.5 cup (4 fl oz) - 74g
Vitamin C
Vit. C
Vitamin D
Vit. D
Vitamin A
Vit. A
Vitamin E
Vit. E
Vitamin B1
Vit. B1
Vitamin B2
Vit. B2
Vitamin B3
Vit. B3
Vitamin B5
Vit. B5
Vitamin B6
Vit. B6
Vitamin B12
Vit. B12
Vitamin K
Vit. K
Folate
Folate
7.7%
0%
4%
0.2%
6.8%
22%
1.2%
13%
5.3%
16%
0%
3%
All nutrients comparison - raw data values
Nutrient
DV% diff.
Vitamin C
58.7mg
2.3mg
63%
Saturated fat
7.778g
1.16g
30%
Carbs
82.57g
30.4g
17%
Calories
408kcal
144kcal
13%
Fats
8.21g
2g
10%
Vitamin B2
0.002mg
0.097mg
7%
Calcium
0mg
54mg
5%
Fiber
0g
1.3g
5%
Phosphorus
5mg
40mg
5%
Vitamin B12
0µg
0.13µg
5%
Zinc
0mg
0.48mg
4%
Vitamin B5
0.035mg
0.224mg
4%
Potassium
2mg
96mg
3%
Magnesium
1mg
8mg
2%
Iron
0.01mg
0.14mg
2%
Copper
0.012mg
0.028mg
2%
Sodium
2mg
46mg
2%
Vitamin E
0.33mg
0.01mg
2%
Vitamin B1
0.001mg
0.027mg
2%
Vitamin B6
0mg
0.023mg
2%
Vitamin K
2.1µg
0µg
2%
Protein
0.41g
1.1g
1%
Vitamin A
0µg
12µg
1%
Selenium
0.8µg
1.5µg
1%
Folate
1µg
4µg
1%
Choline
0mg
7.7mg
1%
Monounsaturated fat
0g
0.53g
1%
Polyunsaturated fat
0g
0.08g
1%
Weight per 100 calories
25g
69g
N/A
Unsaturated / Saturated Fat ratio
0
0.53
N/A
Net carbs
82.57g
29.1g
N/A
Cholesterol
0mg
1mg
0%
Sugar
58.12g
24.32g
N/A
Manganese
0.015mg
0.011mg
0%
Vitamin B3
0.005mg
0.063mg
0%
Trans fat
0.141g
N/A
Macronutrient Comparison
Macronutrient breakdown side-by-side comparison
2
8%
83%
9%
Protein:
0.41 g
Fats:
8.21 g
Carbs:
82.57 g
Water:
8.51 g
Other:
0.3 g
3
2%
30%
66%
Protein:
1.1 g
Fats:
2 g
Carbs:
30.4 g
Water:
66.1 g
Other:
0.4 g
Contains
more
Fats Fats
+310.5%
Contains
more
Carbs Carbs
+171.6%
Contains
more
Protein Protein
+168.3%
Contains
more
Water Water
+676.7%
Contains
more
Other Other
+33.3%
Fat Type Comparison
Fat type breakdown side-by-side comparison
0
100%
Saturated fat:
Sat. Fat
7.778 g
Monounsaturated fat:
Mono. Fat
0 g
Polyunsaturated fat:
Poly. Fat
0 g
3
66%
30%
5%
Saturated fat:
Sat. Fat
1.16 g
Monounsaturated fat:
Mono. Fat
0.53 g
Polyunsaturated fat:
Poly. Fat
0.08 g
Contains
less
Sat. Fat Saturated fat
-85.1%
Contains
more
Mono. Fat Monounsaturated fat
+∞%
Contains
more
Poly. Fat Polyunsaturated fat
+∞%