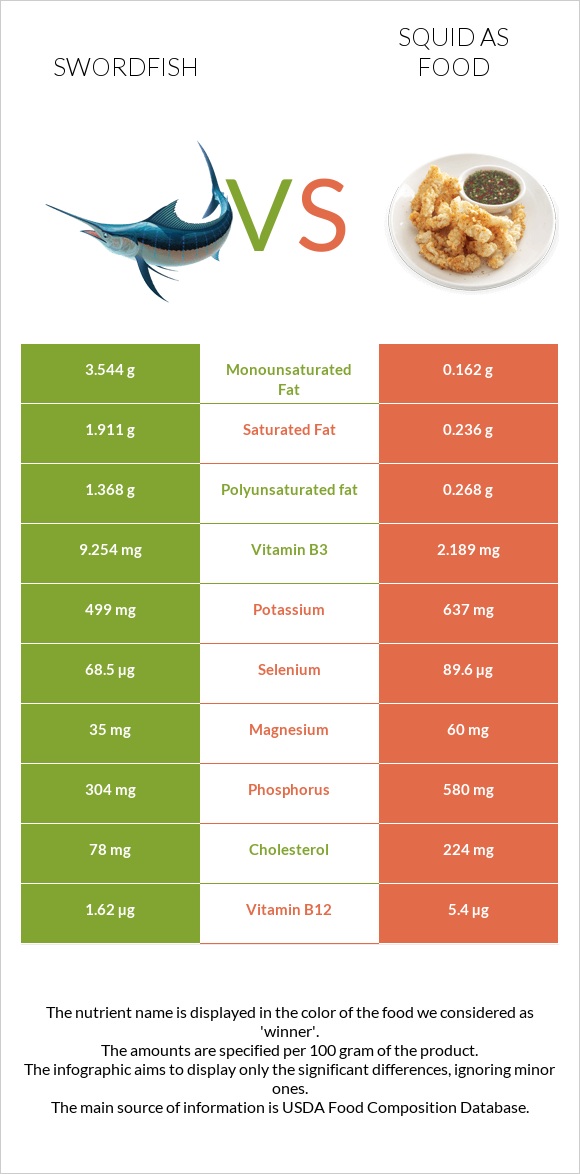
Significant differences between swordfish and squid Swordfish has more vitamin B3 and vitamin B6; however, squid is richer in vitamin B12, iron, vitamin B2, copper, phosphorus, and selenium. Squid covers your daily vitamin B12 needs 158% more than swordfish. Squid has 4 times less vitamin B3 than swordfish. Swordfish has 9.254mg of vitamin B3, while squid has 2.189mg. Swordfish contains less cholesterol. Specific food types used in this comparison are Fish, swordfish, cooked, dry heat and Mollusks, cuttlefish, mixed species, cooked, moist heat .
Infographic
Mineral Comparison
Mineral comparison score is based on the number of minerals by which one or the other food is richer. The "coverage" charts below show how much of the daily needs can be covered by 300 grams of the food.
1
100 g
300 g
3 oz - 85g 1 piece - 106g
Magnesium
Magnesium
Calcium
Calcium
Potassium
Potassium
Iron
Iron
Copper
Copper
Zinc
Zinc
Phosphorus
Phosphorus
Sodium
Sodium
Manganese
Manganese
Selenium
Selenium
25%
1.8%
44%
17%
15%
21%
130%
13%
1.7%
374%
9
100 g
300 g
3 oz - 85g
Magnesium
Magnesium
Calcium
Calcium
Potassium
Potassium
Iron
Iron
Copper
Copper
Zinc
Zinc
Phosphorus
Phosphorus
Sodium
Sodium
Manganese
Manganese
Selenium
Selenium
43%
54%
56%
407%
333%
94%
249%
97%
27%
489%
Vitamin Comparison
Vitamin comparison score is based on the number of vitamins by which one or the other food is richer. The "coverage" charts below show how much of the daily needs can be covered by 300 grams of the food.
6
100 g
300 g
3 oz - 85g 1 piece - 106g
Vitamin C
Vit. C
Vitamin D
Vit. D
Vitamin A
Vit. A
Vitamin E
Vit. E
Vitamin B1
Vit. B1
Vitamin B2
Vit. B2
Vitamin B3
Vit. B3
Vitamin B5
Vit. B5
Vitamin B6
Vit. B6
Vitamin B12
Vit. B12
Vitamin K
Vit. K
Folate
Folate
0%
249%
14%
48%
22%
15%
174%
25%
142%
203%
0.25%
1.5%
6
100 g
300 g
3 oz - 85g
Vitamin C
Vit. C
Vitamin D
Vit. D
Vitamin A
Vit. A
Vitamin E
Vit. E
Vitamin B1
Vit. B1
Vitamin B2
Vit. B2
Vitamin B3
Vit. B3
Vitamin B5
Vit. B5
Vitamin B6
Vit. B6
Vitamin B12
Vit. B12
Vitamin K
Vit. K
Folate
Folate
28%
0%
68%
0%
4.3%
399%
41%
54%
62%
675%
0%
18%
All nutrients comparison - raw data values
Nutrient
DV% diff.
Vitamin B12
1.62µg
5.4µg
158%
Iron
0.45mg
10.84mg
130%
Vitamin B2
0.063mg
1.729mg
128%
Copper
0.046mg
0.998mg
106%
Vitamin D*
666 IU
83%
Vitamin D
16.6µg
83%
Cholesterol
78mg
224mg
49%
Vitamin B3
9.254mg
2.189mg
44%
Phosphorus
304mg
580mg
39%
Selenium
68.5µg
89.6µg
38%
Sodium
97mg
744mg
28%
Vitamin B6
0.615mg
0.27mg
27%
Zinc
0.78mg
3.46mg
24%
Protein
23.45g
32.48g
18%
Vitamin A
43µg
203µg
18%
Calcium
6mg
180mg
17%
Vitamin E
2.41mg
16%
Choline
77.5mg
14%
Fats
7.93g
1.4g
10%
Vitamin B5
0.417mg
0.9mg
10%
Vitamin C
0mg
8.5mg
9%
Manganese
0.013mg
0.209mg
9%
Saturated fat
1.911g
0.236g
8%
Monounsaturated fat
3.544g
0.162g
8%
Polyunsaturated fat
1.368g
0.268g
7%
Magnesium
35mg
60mg
6%
Vitamin B1
0.089mg
0.017mg
6%
Folate
2µg
24µg
6%
Potassium
499mg
637mg
4%
Calories
172kcal
158kcal
1%
Carbs
0g
1.64g
1%
Protein per 100 calories
14g
21g
N/A
Calories per 10 g protein
73kcal
49kcal
N/A
Weight per 100 calories
58g
63g
N/A
Unsaturated / Saturated Fat ratio
2.6
1.8
N/A
Net carbs
0g
1.64g
N/A
Vitamin K
0.1µg
0%
Trans fat
0.056g
N/A
Tryptophan
0.265mg
0.364mg
0%
Threonine
1.035mg
1.398mg
0%
Isoleucine
1.088mg
1.414mg
0%
Leucine
1.919mg
2.287mg
0%
Lysine
2.168mg
2.427mg
0%
Methionine
0.699mg
0.733mg
0%
Phenylalanine
0.922mg
1.164mg
0%
Valine
1.216mg
1.419mg
0%
Histidine
0.695mg
0.624mg
0%
Omega-3 - EPA
0.127g
0.078g
N/A
Omega-3 - DHA
0.772g
0.132g
N/A
Omega-3 - DPA
0.168g
0.012g
N/A
Omega-6 - Eicosadienoic acid
0.022g
N/A
Macronutrient Comparison
Macronutrient breakdown side-by-side comparison
2
23%
8%
68%
Protein:
23.45 g
Fats:
7.93 g
Carbs:
0 g
Water:
68.26 g
Other:
0.36 g
3
32%
61%
3%
Protein:
32.48 g
Fats:
1.4 g
Carbs:
1.64 g
Water:
61.12 g
Other:
3.36 g
Contains
more
Fats Fats
+466.4%
Contains
more
Water Water
+11.7%
Contains
more
Protein Protein
+38.5%
Contains
more
Carbs Carbs
+∞%
Contains
more
Other Other
+833.3%
Fat Type Comparison
Fat type breakdown side-by-side comparison
2
28%
52%
20%
Saturated fat:
Sat. Fat
1.911 g
Monounsaturated fat:
Mono. Fat
3.544 g
Polyunsaturated fat:
Poly. Fat
1.368 g
1
35%
24%
40%
Saturated fat:
Sat. Fat
0.236 g
Monounsaturated fat:
Mono. Fat
0.162 g
Polyunsaturated fat:
Poly. Fat
0.268 g
Contains
more
Mono. Fat Monounsaturated fat
+2087.7%
Contains
more
Poly. Fat Polyunsaturated fat
+410.4%
Contains
less
Sat. Fat Saturated fat
-87.7%