Taco vs. Chicken fingers — In-Depth Nutrition Comparison
Compare
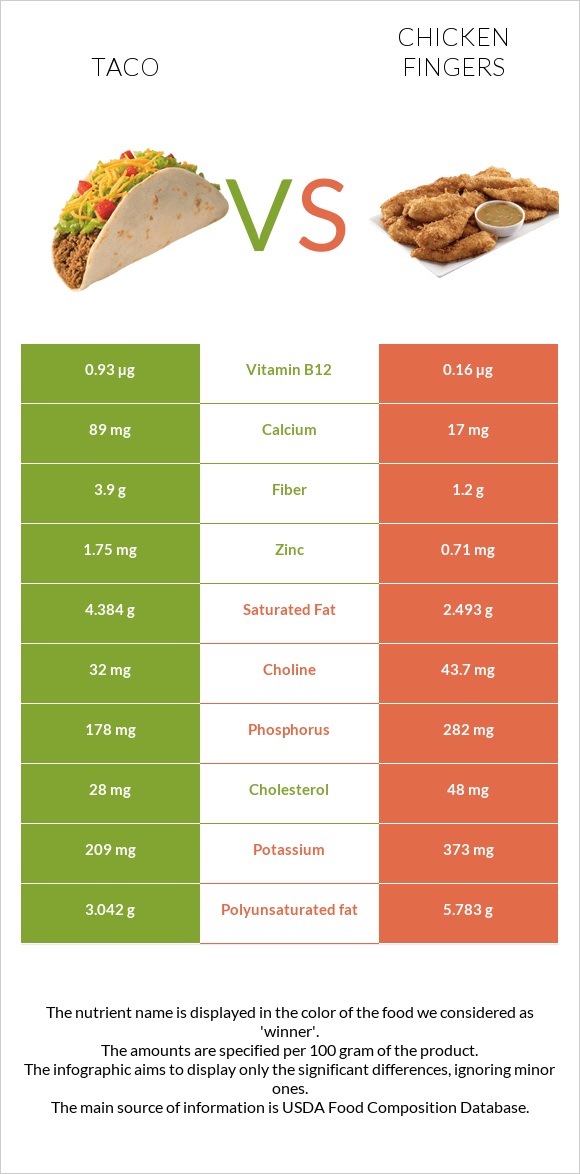
Summary of differences between taco and chicken fingers
- Taco has more vitamin B12, fiber, and zinc, while chicken fingers have more vitamin B3, vitamin B6, vitamin E, selenium, and phosphorus.
- Chicken fingers cover your daily need for vitamin B3, 41% more than taco.
- Taco contains 6 times more vitamin B12 than chicken fingers. While taco contains 0.93µg of vitamin B12, chicken fingers contain only 0.16µg.
- The amount of saturated fat in chicken fingers is lower.
These are the specific foods used in this comparison Fast foods, taco with beef, cheese, and lettuce, hard shell and Fast foods, chicken tenders.
Infographic
Infographic link
Mineral Comparison
Mineral comparison score is based on the number of minerals by which one or the other food is richer. The "coverage" charts below show how much of the daily needs can be covered by 300 grams of the food.
| Contains more MagnesiumMagnesium | +14.3% |
| Contains more CalciumCalcium | +423.5% |
| Contains more IronIron | +63% |
| Contains more CopperCopper | +11.6% |
| Contains more ZincZinc | +146.5% |
| Contains less SodiumSodium | -48.4% |
| Contains more PotassiumPotassium | +78.5% |
| Contains more PhosphorusPhosphorus | +58.4% |
| Contains more SeleniumSelenium | +90.2% |
Vitamin Comparison
Vitamin comparison score is based on the number of vitamins by which one or the other food is richer. The "coverage" charts below show how much of the daily needs can be covered by 300 grams of the food.
| Contains more Vitamin AVitamin A | +566.7% |
| Contains more Vitamin B12Vitamin B12 | +481.3% |
| Contains more Vitamin KVitamin K | +91.3% |
| Contains more Vitamin CVitamin C | +175% |
| Contains more Vitamin DVitamin D | +100% |
| Contains more Vitamin EVitamin E | +428.3% |
| Contains more Vitamin B1Vitamin B1 | +120% |
| Contains more Vitamin B2Vitamin B2 | +198.3% |
| Contains more Vitamin B3Vitamin B3 | +398% |
| Contains more Vitamin B6Vitamin B6 | +373.3% |
All nutrients comparison - raw data values
| Nutrient |  |
 |
DV% diff. |
| Vitamin B3 | 1.65mg | 8.217mg | 41% |
| Vitamin B12 | 0.93µg | 0.16µg | 32% |
| Vitamin B6 | 0.09mg | 0.426mg | 26% |
| Vitamin B5 | 1.244mg | 25% | |
| Protein | 8.86g | 19.22g | 21% |
| Polyunsaturated fat | 3.042g | 5.783g | 18% |
| Vitamin E | 0.6mg | 3.17mg | 17% |
| Sodium | 397mg | 769mg | 16% |
| Phosphorus | 178mg | 282mg | 15% |
| Selenium | 9.2µg | 17.5µg | 15% |
| Fiber | 3.9g | 1.2g | 11% |
| Zinc | 1.75mg | 0.71mg | 9% |
| Vitamin B2 | 0.06mg | 0.179mg | 9% |
| Saturated fat | 4.384g | 2.493g | 9% |
| Cholesterol | 28mg | 48mg | 7% |
| Calcium | 89mg | 17mg | 7% |
| Iron | 1.19mg | 0.73mg | 6% |
| Vitamin K | 15.3µg | 8µg | 6% |
| Potassium | 209mg | 373mg | 5% |
| Vitamin B1 | 0.05mg | 0.11mg | 5% |
| Calories | 226kcal | 271kcal | 2% |
| Fats | 12.7g | 13.95g | 2% |
| Vitamin A | 20µg | 3µg | 2% |
| Choline | 32mg | 43.7mg | 2% |
| Vitamin C | 0.4mg | 1.1mg | 1% |
| Carbs | 19.85g | 17.25g | 1% |
| Vitamin D | 0.1µg | 0.2µg | 1% |
| Magnesium | 32mg | 28mg | 1% |
| Copper | 0.077mg | 0.069mg | 1% |
| Starch | 14.78g | 17.03g | 1% |
| Manganese | 0.249mg | 0.228mg | 1% |
| Monounsaturated fat | 4.411g | 4.83g | 1% |
| Protein per 100 calories | 3.9g | 7.1g | N/A |
| Calories per 10 g protein | 255kcal | 141kcal | N/A |
| Weight per 100 calories | 44g | 37g | N/A |
| Unsaturated / Saturated Fat ratio | 1.7 | 4.3 | N/A |
| Net carbs | 15.95g | 16.05g | N/A |
| Vitamin D* | 4 IU | 7 IU | 0% |
| Sugar | 0.9g | 0.4g | N/A |
| Folate | 19µg | 19µg | 0% |
| Trans fat | 0.467g | 0.052g | N/A |
| Tryptophan | 0.222mg | 0% | |
| Threonine | 0.803mg | 0% | |
| Isoleucine | 0.845mg | 0% | |
| Leucine | 1.553mg | 0% | |
| Lysine | 1.616mg | 0% | |
| Methionine | 0.518mg | 0% | |
| Phenylalanine | 1.437mg | 0% | |
| Valine | 0.908mg | 0% | |
| Histidine | 0.655mg | 0% | |
| Fructose | 0.3g | 0g | 0% |
| Omega-3 - EPA | 0.005g | 0g | N/A |
| Omega-3 - DHA | 0g | 0.002g | N/A |
| Omega-3 - ALA | 0.166g | 0.211g | N/A |
| Omega-3 - DPA | 0.006g | 0.003g | N/A |
| Omega-3 - Eicosatrienoic acid | 0.001g | 0g | N/A |
| Omega-6 - Gamma-linoleic acid | 0.002g | 0.015g | N/A |
| Omega-6 - Dihomo-gamma-linoleic acid | 0.011g | 0.008g | N/A |
| Omega-6 - Eicosadienoic acid | 0.004g | 0.007g | N/A |
| Omega-6 - Linoleic acid | 2.708g | 5.439g | N/A |
Macronutrient Comparison
Macronutrient breakdown side-by-side comparison
Protein:
8.86 g
Fats:
12.7 g
Carbs:
19.85 g
Water:
57.02 g
Other:
1.57 g
Protein:
19.22 g
Fats:
13.95 g
Carbs:
17.25 g
Water:
46.64 g
Other:
2.94 g
| Contains more CarbsCarbs | +15.1% |
| Contains more WaterWater | +22.3% |
| Contains more ProteinProtein | +116.9% |
| Contains more OtherOther | +87.3% |
~equal in
Fats
~13.95g
Fat Type Comparison
Fat type breakdown side-by-side comparison
Saturated fat:
Sat. Fat
4.384 g
Monounsaturated fat:
Mono. Fat
4.411 g
Polyunsaturated fat:
Poly. Fat
3.042 g
Saturated fat:
Sat. Fat
2.493 g
Monounsaturated fat:
Mono. Fat
4.83 g
Polyunsaturated fat:
Poly. Fat
5.783 g
| Contains less Sat. FatSaturated fat | -43.1% |
| Contains more Poly. FatPolyunsaturated fat | +90.1% |
~equal in
Monounsaturated fat
~4.83g
Carbohydrate type comparison
Carbohydrate type breakdown side-by-side comparison
Starch:
14.78 g
Sucrose:
0.4 g
Glucose:
0.2 g
Fructose:
0.3 g
Lactose:
0 g
Maltose:
0 g
Galactose:
0 g
Starch:
17.03 g
Sucrose:
0.4 g
Glucose:
0 g
Fructose:
0 g
Lactose:
0 g
Maltose:
0 g
Galactose:
0 g
| Contains more GlucoseGlucose | +∞% |
| Contains more FructoseFructose | +∞% |
| Contains more StarchStarch | +15.2% |
~equal in
Sucrose
~0.4g
~equal in
Lactose
~0g
~equal in
Maltose
~0g
~equal in
Galactose
~0g


