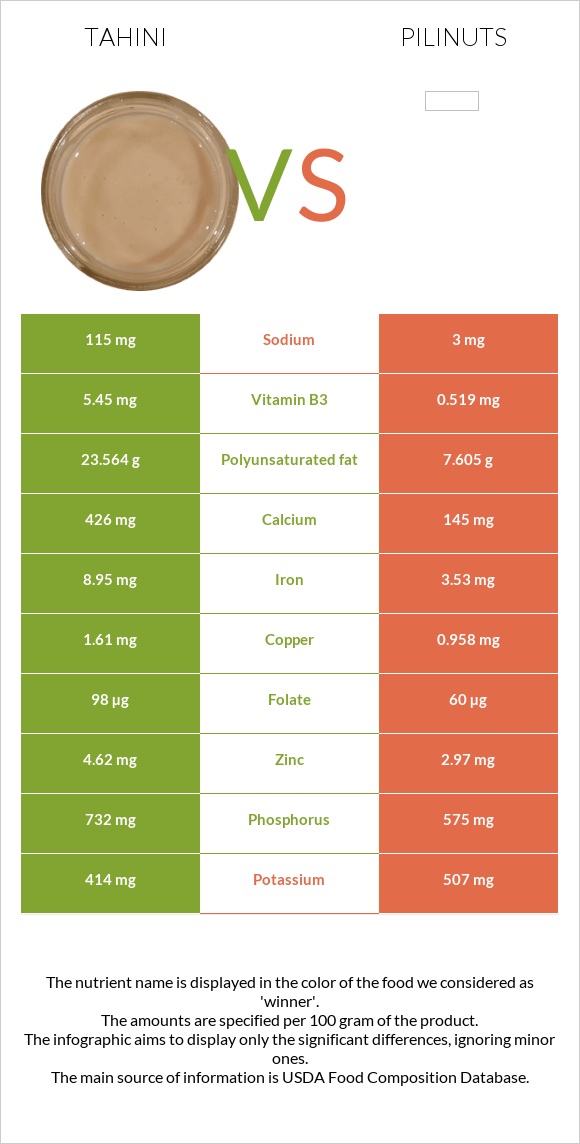
Differences between tahini and pili nuts Tahini has more copper, iron, vitamin B3, vitamin B2, calcium, vitamin B1, and phosphorus, while pili nuts have more magnesium and manganese. Pili nuts' daily need coverage for saturated fat is 118% higher. Pili nuts contain 11 times less vitamin B3 than tahini. Tahini contains 5.45mg of vitamin B3, while pili nuts contain 0.519mg. The amount of saturated fat in tahini is lower. The food types used in this comparison are Seeds, sesame butter, tahini, from roasted, and toasted kernels (most common type) and Nuts, pilinuts, dried .
Infographic
Mineral Comparison
Mineral comparison score is based on the number of minerals by which one or the other food is richer. The "coverage" charts below show how much of the daily needs can be covered by 300 grams of the food.
6
100 g
300 g
1 tbsp - 15g 1 oz - 28.35g
Magnesium
Magnesium
Calcium
Calcium
Potassium
Potassium
Iron
Iron
Copper
Copper
Zinc
Zinc
Phosphorus
Phosphorus
Sodium
Sodium
Manganese
Manganese
Selenium
Selenium
68%
128%
37%
336%
537%
126%
314%
15%
190%
188%
4
100 g
300 g
1 oz (15 kernels) - 28.35g 1 cup - 120g
Magnesium
Magnesium
Calcium
Calcium
Potassium
Potassium
Iron
Iron
Copper
Copper
Zinc
Zinc
Phosphorus
Phosphorus
Sodium
Sodium
Manganese
Manganese
Selenium
Selenium
216%
44%
45%
132%
319%
81%
246%
0.39%
302%
0%
Vitamin Comparison
Vitamin comparison score is based on the number of vitamins by which one or the other food is richer. The "coverage" charts below show how much of the daily needs can be covered by 300 grams of the food.
8
100 g
300 g
1 tbsp - 15g 1 oz - 28.35g
Vitamin C
Vit. C
Vitamin D
Vit. D
Vitamin A
Vit. A
Vitamin E
Vit. E
Vitamin B1
Vit. B1
Vitamin B2
Vit. B2
Vitamin B3
Vit. B3
Vitamin B5
Vit. B5
Vitamin B6
Vit. B6
Vitamin B12
Vit. B12
Vitamin K
Vit. K
Folate
Folate
0%
0%
1%
5%
305%
109%
102%
42%
34%
0%
0%
74%
1
100 g
300 g
1 oz (15 kernels) - 28.35g 1 cup - 120g
Vitamin C
Vit. C
Vitamin D
Vit. D
Vitamin A
Vit. A
Vitamin E
Vit. E
Vitamin B1
Vit. B1
Vitamin B2
Vit. B2
Vitamin B3
Vit. B3
Vitamin B5
Vit. B5
Vitamin B6
Vit. B6
Vitamin B12
Vit. B12
Vitamin K
Vit. K
Folate
Folate
2%
0%
0.67%
0%
228%
21%
9.7%
29%
27%
0%
0%
45%
All nutrients comparison - raw data values
Nutrient
DV% diff.
Saturated fat
7.529g
31.184g
108%
Polyunsaturated fat
23.564g
7.605g
106%
Copper
1.61mg
0.958mg
72%
Iron
8.95mg
3.53mg
68%
Selenium
34.4µg
63%
Magnesium
95mg
302mg
49%
Monounsaturated fat
20.302g
37.229g
42%
Fats
53.76g
79.55g
40%
Fiber
9.3g
37%
Manganese
1.456mg
2.313mg
37%
Vitamin B3
5.45mg
0.519mg
31%
Vitamin B2
0.473mg
0.093mg
29%
Calcium
426mg
145mg
28%
Vitamin B1
1.22mg
0.913mg
26%
Phosphorus
732mg
575mg
22%
Zinc
4.62mg
2.97mg
15%
Protein
17g
10.8g
12%
Folate
98µg
60µg
10%
Calories
595kcal
719kcal
6%
Carbs
21.19g
3.98g
6%
Sodium
115mg
3mg
5%
Choline
25.8mg
5%
Vitamin B5
0.693mg
0.479mg
4%
Potassium
414mg
507mg
3%
Vitamin B6
0.149mg
0.115mg
3%
Vitamin E
0.25mg
2%
Vitamin C
0mg
0.6mg
1%
Protein per 100 calories
2.9g
1.5g
N/A
Calories per 10 g protein
350kcal
666kcal
N/A
Weight per 100 calories
17g
14g
N/A
Unsaturated / Saturated Fat ratio
5.8
1.4
N/A
Net carbs
11.89g
3.98g
N/A
Sugar
0.49g
N/A
Vitamin A
3µg
2µg
0%
Tryptophan
0.372mg
0.189mg
0%
Threonine
0.706mg
0.407mg
0%
Isoleucine
0.731mg
0.483mg
0%
Leucine
1.302mg
0.89mg
0%
Lysine
0.545mg
0.369mg
0%
Methionine
0.561mg
0.395mg
0%
Phenylalanine
0.901mg
0.497mg
0%
Valine
0.95mg
0.701mg
0%
Histidine
0.5mg
0.255mg
0%
Macronutrient Comparison
Macronutrient breakdown side-by-side comparison
4
17%
54%
21%
3%
5%
Protein:
17 g
Fats:
53.76 g
Carbs:
21.19 g
Water:
3.05 g
Other:
5 g
1
11%
80%
4%
3%
3%
Protein:
10.8 g
Fats:
79.55 g
Carbs:
3.98 g
Water:
2.77 g
Other:
2.9 g
Contains
more
Protein Protein
+57.4%
Contains
more
Carbs Carbs
+432.4%
Contains
more
Other Other
+72.4%
Contains
more
Fats Fats
+48%
Fat Type Comparison
Fat type breakdown side-by-side comparison
2
15%
40%
46%
Saturated fat:
Sat. Fat
7.529 g
Monounsaturated fat:
Mono. Fat
20.302 g
Polyunsaturated fat:
Poly. Fat
23.564 g
1
41%
49%
10%
Saturated fat:
Sat. Fat
31.184 g
Monounsaturated fat:
Mono. Fat
37.229 g
Polyunsaturated fat:
Poly. Fat
7.605 g
Contains
less
Sat. Fat Saturated fat
-75.9%
Contains
more
Poly. Fat Polyunsaturated fat
+209.8%
Contains
more
Mono. Fat Monounsaturated fat
+83.4%