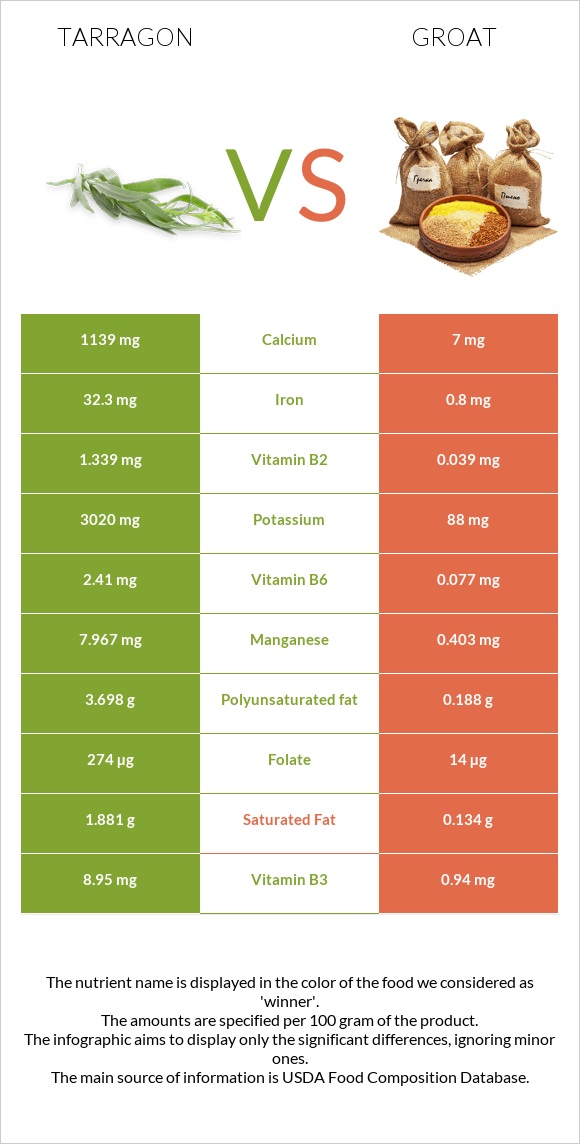
How are tarragon and groat different? Tarragon is higher in iron, manganese, vitamin B6, calcium, vitamin A, potassium, vitamin B2, folate, and vitamin C; however, groat is richer in copper. Daily need coverage for iron for tarragon is 376% higher. Tarragon has a lower glycemic index (0) than groat (54). Spices, tarragon, dried and Buckwheat are the varieties used in this article.
Infographic
Mineral Comparison
Mineral comparison score is based on the number of minerals by which one or the other food is richer. The "coverage" charts below show how much of the daily needs can be covered by 300 grams of the food.
6
100 g
300 g
0.25 tsp - 0.5g 1 tsp, ground - 1.6g 1 tbsp, leaves - 1.8g 1 tbsp, ground - 4.8g
Magnesium
Magnesium
Calcium
Calcium
Potassium
Potassium
Iron
Iron
Copper
Copper
Zinc
Zinc
Phosphorus
Phosphorus
Sodium
Sodium
Manganese
Manganese
Selenium
Selenium
248%
342%
266%
1211%
226%
106%
134%
8.1%
1039%
24%
4
100 g
300 g
1 cup - 170g
Magnesium
Magnesium
Calcium
Calcium
Potassium
Potassium
Iron
Iron
Copper
Copper
Zinc
Zinc
Phosphorus
Phosphorus
Sodium
Sodium
Manganese
Manganese
Selenium
Selenium
165%
5.4%
41%
83%
367%
65%
149%
0.13%
170%
45%
Vitamin Comparison
Vitamin comparison score is based on the number of vitamins by which one or the other food is richer. The "coverage" charts below show how much of the daily needs can be covered by 300 grams of the food.
7
100 g
300 g
0.25 tsp - 0.5g 1 tsp, ground - 1.6g 1 tbsp, leaves - 1.8g 1 tbsp, ground - 4.8g
Vitamin C
Vit. C
Vitamin D
Vit. D
Vitamin A
Vit. A
Vitamin E
Vit. E
Vitamin B1
Vit. B1
Vitamin B2
Vit. B2
Vitamin B3
Vit. B3
Vitamin B5
Vit. B5
Vitamin B6
Vit. B6
Vitamin B12
Vit. B12
Vitamin K
Vit. K
Folate
Folate
167%
0%
70%
0%
63%
309%
168%
0%
556%
0%
0%
206%
1
100 g
300 g
1 cup - 170g
Vitamin C
Vit. C
Vitamin D
Vit. D
Vitamin A
Vit. A
Vitamin E
Vit. E
Vitamin B1
Vit. B1
Vitamin B2
Vit. B2
Vitamin B3
Vit. B3
Vitamin B5
Vit. B5
Vitamin B6
Vit. B6
Vitamin B12
Vit. B12
Vitamin K
Vit. K
Folate
Folate
0%
0%
0%
0%
25%
98%
132%
74%
48%
0%
0%
23%
All nutrients comparison - raw data values
Nutrient
DV% diff.
Iron
32.3mg
2.2mg
376%
Manganese
7.967mg
1.3mg
290%
Vitamin B6
2.41mg
0.21mg
169%
Calcium
1139mg
18mg
112%
Potassium
3020mg
460mg
75%
Vitamin B2
1.339mg
0.425mg
70%
Folate
274µg
30µg
61%
Vitamin C
50mg
0mg
56%
Copper
0.677mg
1.1mg
47%
Magnesium
347mg
231mg
28%
Vitamin B5
1.233mg
25%
Vitamin A
210µg
0µg
23%
Protein
22.77g
13.25g
19%
Polyunsaturated fat
3.698g
1.039g
18%
Zinc
3.9mg
2.4mg
14%
Vitamin B1
0.251mg
0.101mg
13%
Vitamin B3
8.95mg
7.02mg
12%
Fiber
7.4g
10g
10%
Carbs
50.22g
71.5g
7%
Selenium
4.4µg
8.3µg
7%
Fats
7.24g
3.4g
6%
Phosphorus
313mg
347mg
5%
Saturated fat
1.881g
0.741g
5%
Sodium
62mg
1mg
3%
Calories
295kcal
343kcal
2%
Monounsaturated fat
0.474g
1.04g
1%
Protein per 100 calories
7.7g
3.9g
N/A
Calories per 10 g protein
130kcal
259kcal
N/A
Weight per 100 calories
34g
29g
N/A
Unsaturated / Saturated Fat ratio
2.2
2.8
N/A
Net carbs
42.82g
61.5g
N/A
Tryptophan
0.192mg
0%
Threonine
0.506mg
0%
Isoleucine
0.498mg
0%
Leucine
0.832mg
0%
Lysine
0.672mg
0%
Methionine
0.172mg
0%
Phenylalanine
0.52mg
0%
Valine
0.678mg
0%
Histidine
0.309mg
0%
Macronutrient Comparison
Macronutrient breakdown side-by-side comparison
3
23%
7%
50%
8%
12%
Protein:
22.77 g
Fats:
7.24 g
Carbs:
50.22 g
Water:
7.74 g
Other:
12.03 g
2
13%
3%
72%
10%
2%
Protein:
13.25 g
Fats:
3.4 g
Carbs:
71.5 g
Water:
9.75 g
Other:
2.1 g
Contains
more
Protein Protein
+71.8%
Contains
more
Fats Fats
+112.9%
Contains
more
Other Other
+472.9%
Contains
more
Carbs Carbs
+42.4%
Contains
more
Water Water
+26%
Fat Type Comparison
Fat type breakdown side-by-side comparison
1
31%
8%
61%
Saturated fat:
Sat. Fat
1.881 g
Monounsaturated fat:
Mono. Fat
0.474 g
Polyunsaturated fat:
Poly. Fat
3.698 g
2
26%
37%
37%
Saturated fat:
Sat. Fat
0.741 g
Monounsaturated fat:
Mono. Fat
1.04 g
Polyunsaturated fat:
Poly. Fat
1.039 g
Contains
more
Poly. Fat Polyunsaturated fat
+255.9%
Contains
less
Sat. Fat Saturated fat
-60.6%
Contains
more
Mono. Fat Monounsaturated fat
+119.4%