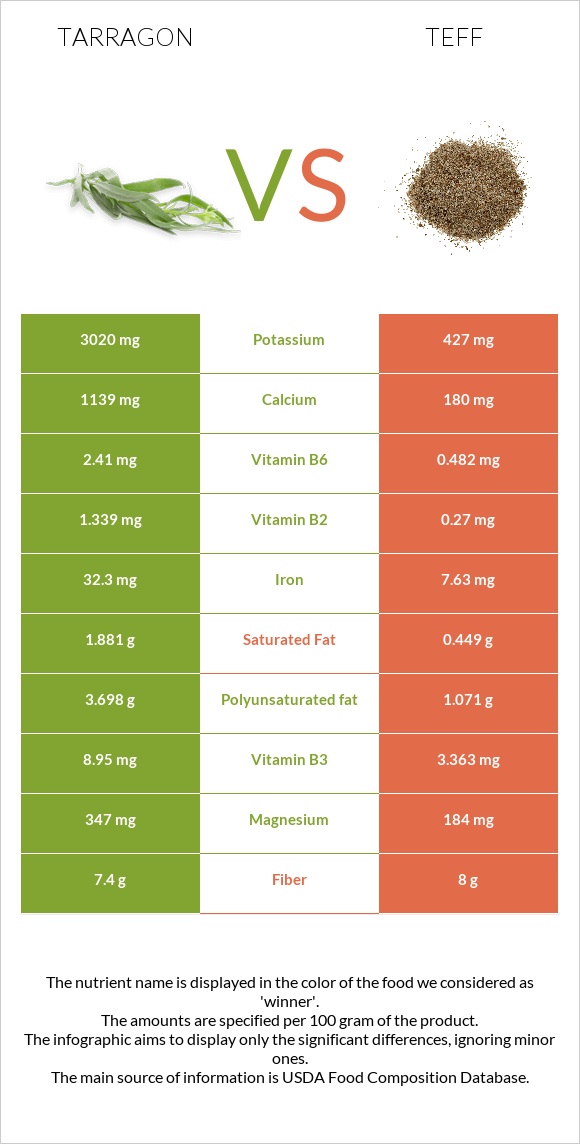
Summary of differences between tarragon and teff Tarragon has more iron, vitamin B6, calcium, vitamin A, vitamin B2, potassium, magnesium, and vitamin B3, while teff has more manganese and phosphorus. Tarragon covers your daily need for iron, 308% more than teff. Tarragon contains 467 times more vitamin A than teff. While tarragon contains 4200 IU of vitamin A, teff contains only 9 IU. These are the specific foods used in this comparison Spices, tarragon, dried and Teff, uncooked .
Infographic
Mineral Comparison
Mineral comparison score is based on the number of minerals by which one or the other food is richer. The "coverage" charts below show how much of the daily needs can be covered by 300 grams of the food.
4
100 g
300 g
0.25 tsp - 0.5g 1 tsp, ground - 1.6g 1 tbsp, leaves - 1.8g 1 tbsp, ground - 4.8g
Magnesium
Magnesium
Calcium
Calcium
Potassium
Potassium
Iron
Iron
Copper
Copper
Zinc
Zinc
Phosphorus
Phosphorus
Sodium
Sodium
Manganese
Manganese
Selenium
Selenium
248%
342%
266%
1211%
226%
106%
134%
8.1%
1039%
24%
4
100 g
300 g
1 cup - 193g
Magnesium
Magnesium
Calcium
Calcium
Potassium
Potassium
Iron
Iron
Copper
Copper
Zinc
Zinc
Phosphorus
Phosphorus
Sodium
Sodium
Manganese
Manganese
Selenium
Selenium
131%
54%
38%
286%
270%
99%
184%
1.6%
1205%
24%
Vitamin Comparison
Vitamin comparison score is based on the number of vitamins by which one or the other food is richer. The "coverage" charts below show how much of the daily needs can be covered by 300 grams of the food.
6
100 g
300 g
0.25 tsp - 0.5g 1 tsp, ground - 1.6g 1 tbsp, leaves - 1.8g 1 tbsp, ground - 4.8g
Vitamin C
Vit. C
Vitamin D
Vit. D
Vitamin A
Vit. A
Vitamin E
Vit. E
Vitamin B1
Vit. B1
Vitamin B2
Vit. B2
Vitamin B3
Vit. B3
Vitamin B5
Vit. B5
Vitamin B6
Vit. B6
Vitamin B12
Vit. B12
Vitamin K
Vit. K
Folate
Folate
167%
0%
70%
0%
63%
309%
168%
0%
556%
0%
0%
206%
4
100 g
300 g
1 cup - 193g
Vitamin C
Vit. C
Vitamin D
Vit. D
Vitamin A
Vit. A
Vitamin E
Vit. E
Vitamin B1
Vit. B1
Vitamin B2
Vit. B2
Vitamin B3
Vit. B3
Vitamin B5
Vit. B5
Vitamin B6
Vit. B6
Vitamin B12
Vit. B12
Vitamin K
Vit. K
Folate
Folate
0%
0%
0%
1.6%
98%
62%
63%
57%
111%
0%
4.8%
0%
All nutrients comparison - raw data values
Nutrient
DV% diff.
Iron
32.3mg
7.63mg
308%
Vitamin B6
2.41mg
0.482mg
148%
Calcium
1139mg
180mg
96%
Vitamin B2
1.339mg
0.27mg
82%
Potassium
3020mg
427mg
76%
Folate
274µg
69%
Vitamin C
50mg
56%
Manganese
7.967mg
9.24mg
55%
Magnesium
347mg
184mg
39%
Vitamin B3
8.95mg
3.363mg
35%
Vitamin A
210µg
0µg
23%
Protein
22.77g
13.3g
19%
Vitamin B5
0.942mg
19%
Polyunsaturated fat
3.698g
1.071g
18%
Phosphorus
313mg
429mg
17%
Copper
0.677mg
0.81mg
15%
Starch
36.56g
15%
Vitamin B1
0.251mg
0.39mg
12%
Carbs
50.22g
73.13g
8%
Fats
7.24g
2.38g
7%
Saturated fat
1.881g
0.449g
7%
Calories
295kcal
367kcal
4%
Fiber
7.4g
8g
2%
Zinc
3.9mg
3.63mg
2%
Sodium
62mg
12mg
2%
Vitamin K
1.9µg
2%
Choline
13.1mg
2%
Vitamin E
0.08mg
1%
Fructose
0.47g
1%
Protein per 100 calories
7.7g
3.6g
N/A
Calories per 10 g protein
130kcal
276kcal
N/A
Weight per 100 calories
34g
27g
N/A
Unsaturated / Saturated Fat ratio
2.2
3.7
N/A
Net carbs
42.82g
65.13g
N/A
Sugar
1.84g
N/A
Selenium
4.4µg
4.4µg
0%
Monounsaturated fat
0.474g
0.589g
0%
Tryptophan
0.139mg
0%
Threonine
0.51mg
0%
Isoleucine
0.501mg
0%
Leucine
1.068mg
0%
Lysine
0.376mg
0%
Methionine
0.428mg
0%
Phenylalanine
0.698mg
0%
Valine
0.686mg
0%
Histidine
0.301mg
0%
Omega-3 - ALA
0.135g
N/A
Macronutrient Comparison
Macronutrient breakdown side-by-side comparison
3
23%
7%
50%
8%
12%
Protein:
22.77 g
Fats:
7.24 g
Carbs:
50.22 g
Water:
7.74 g
Other:
12.03 g
2
13%
2%
73%
9%
2%
Protein:
13.3 g
Fats:
2.38 g
Carbs:
73.13 g
Water:
8.82 g
Other:
2.37 g
Contains
more
Protein Protein
+71.2%
Contains
more
Fats Fats
+204.2%
Contains
more
Other Other
+407.6%
Contains
more
Carbs Carbs
+45.6%
Contains
more
Water Water
+14%
Fat Type Comparison
Fat type breakdown side-by-side comparison
1
31%
8%
61%
Saturated fat:
Sat. Fat
1.881 g
Monounsaturated fat:
Mono. Fat
0.474 g
Polyunsaturated fat:
Poly. Fat
3.698 g
2
21%
28%
51%
Saturated fat:
Sat. Fat
0.449 g
Monounsaturated fat:
Mono. Fat
0.589 g
Polyunsaturated fat:
Poly. Fat
1.071 g
Contains
more
Poly. Fat Polyunsaturated fat
+245.3%
Contains
less
Sat. Fat Saturated fat
-76.1%
Contains
more
Mono. Fat Monounsaturated fat
+24.3%