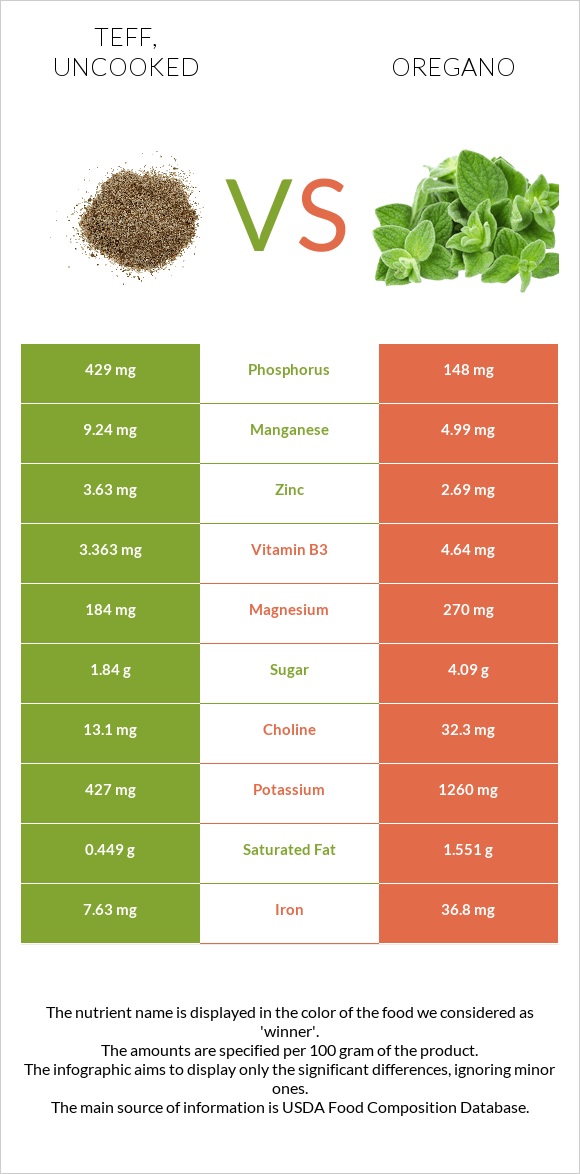
How are teff and oregano different? Teff is higher in manganese and phosphorus; however, oregano is richer in vitamin K, iron, calcium, fiber, vitamin E, vitamin B6, vitamin A, and potassium. Daily need coverage for vitamin K for oregano is 516% higher. Teff contains 3 times more phosphorus than oregano. While teff contains 429mg of phosphorus, oregano contains only 148mg. Teff, uncooked and Spices, oregano, dried are the varieties used in this article.
Infographic
Mineral Comparison
Mineral comparison score is based on the number of minerals by which one or the other food is richer. The "coverage" charts below show how much of the daily needs can be covered by 300 grams of the food.
5
100 g
300 g
1 cup - 193g
Magnesium
Magnesium
Calcium
Calcium
Potassium
Potassium
Iron
Iron
Copper
Copper
Zinc
Zinc
Phosphorus
Phosphorus
Sodium
Sodium
Manganese
Manganese
Selenium
Selenium
131%
54%
38%
286%
270%
99%
184%
1.6%
1205%
24%
4
100 g
300 g
0.25 tsp - 0.5g 1 tsp, ground - 1.8g
Magnesium
Magnesium
Calcium
Calcium
Potassium
Potassium
Iron
Iron
Copper
Copper
Zinc
Zinc
Phosphorus
Phosphorus
Sodium
Sodium
Manganese
Manganese
Selenium
Selenium
193%
479%
111%
1380%
211%
73%
63%
3.3%
651%
25%
Vitamin Comparison
Vitamin comparison score is based on the number of vitamins by which one or the other food is richer. The "coverage" charts below show how much of the daily needs can be covered by 300 grams of the food.
1
100 g
300 g
1 cup - 193g
Vitamin C
Vit. C
Vitamin D
Vit. D
Vitamin A
Vit. A
Vitamin E
Vit. E
Vitamin B1
Vit. B1
Vitamin B2
Vit. B2
Vitamin B3
Vit. B3
Vitamin B5
Vit. B5
Vitamin B6
Vit. B6
Vitamin B12
Vit. B12
Vitamin K
Vit. K
Folate
Folate
0%
0%
0%
1.6%
98%
62%
63%
57%
111%
0%
4.8%
0%
8
100 g
300 g
0.25 tsp - 0.5g 1 tsp, ground - 1.8g
Vitamin C
Vit. C
Vitamin D
Vit. D
Vitamin A
Vit. A
Vitamin E
Vit. E
Vitamin B1
Vit. B1
Vitamin B2
Vit. B2
Vitamin B3
Vit. B3
Vitamin B5
Vit. B5
Vitamin B6
Vit. B6
Vitamin B12
Vit. B12
Vitamin K
Vit. K
Folate
Folate
7.7%
0%
28%
365%
44%
122%
87%
55%
241%
0%
1554%
178%
All nutrients comparison - raw data values
Nutrient
DV% diff.
Vitamin K
1.9µg
621.7µg
517%
Iron
7.63mg
36.8mg
365%
Manganese
9.24mg
4.99mg
185%
Calcium
180mg
1597mg
142%
Fiber
8g
42.5g
138%
Vitamin E
0.08mg
18.26mg
121%
Folate
237µg
59%
Vitamin B6
0.482mg
1.044mg
43%
Phosphorus
429mg
148mg
40%
Potassium
427mg
1260mg
25%
Magnesium
184mg
270mg
20%
Copper
0.81mg
0.633mg
20%
Vitamin B2
0.27mg
0.528mg
20%
Vitamin B1
0.39mg
0.177mg
18%
Starch
36.56g
15%
Protein
13.3g
9g
9%
Zinc
3.63mg
2.69mg
9%
Vitamin A
0µg
85µg
9%
Vitamin B3
3.363mg
4.64mg
8%
Calories
367kcal
265kcal
5%
Saturated fat
0.449g
1.551g
5%
Fats
2.38g
4.28g
3%
Vitamin C
2.3mg
3%
Choline
13.1mg
32.3mg
3%
Polyunsaturated fat
1.071g
1.369g
2%
Carbs
73.13g
68.92g
1%
Sodium
12mg
25mg
1%
Fructose
0.47g
1.13g
1%
Protein per 100 calories
3.6g
3.4g
N/A
Calories per 10 g protein
276kcal
294kcal
N/A
Weight per 100 calories
27g
38g
N/A
Unsaturated / Saturated Fat ratio
3.7
1.3
N/A
Net carbs
65.13g
26.42g
N/A
Sugar
1.84g
4.09g
N/A
Selenium
4.4µg
4.5µg
0%
Vitamin B5
0.942mg
0.921mg
0%
Monounsaturated fat
0.589g
0.716g
0%
Tryptophan
0.139mg
0.203mg
0%
Threonine
0.51mg
0.322mg
0%
Isoleucine
0.501mg
0.441mg
0%
Leucine
1.068mg
0.78mg
0%
Lysine
0.376mg
0.5mg
0%
Methionine
0.428mg
0.127mg
0%
Phenylalanine
0.698mg
0.449mg
0%
Valine
0.686mg
0.585mg
0%
Histidine
0.301mg
0.144mg
0%
Omega-3 - ALA
0.135g
0.621g
N/A
Macronutrient Comparison
Macronutrient breakdown side-by-side comparison
2
13%
2%
73%
9%
2%
Protein:
13.3 g
Fats:
2.38 g
Carbs:
73.13 g
Water:
8.82 g
Other:
2.37 g
3
9%
4%
69%
10%
8%
Protein:
9 g
Fats:
4.28 g
Carbs:
68.92 g
Water:
9.93 g
Other:
7.87 g
Contains
more
Protein Protein
+47.8%
Contains
more
Fats Fats
+79.8%
Contains
more
Water Water
+12.6%
Contains
more
Other Other
+232.1%
Fat Type Comparison
Fat type breakdown side-by-side comparison
1
21%
28%
51%
Saturated fat:
Sat. Fat
0.449 g
Monounsaturated fat:
Mono. Fat
0.589 g
Polyunsaturated fat:
Poly. Fat
1.071 g
2
43%
20%
38%
Saturated fat:
Sat. Fat
1.551 g
Monounsaturated fat:
Mono. Fat
0.716 g
Polyunsaturated fat:
Poly. Fat
1.369 g
Contains
less
Sat. Fat Saturated fat
-71.1%
Contains
more
Mono. Fat Monounsaturated fat
+21.6%
Contains
more
Poly. Fat Polyunsaturated fat
+27.8%
Carbohydrate type comparison
Carbohydrate type breakdown side-by-side comparison
2
95%
2%
Starch:
36.56 g
Sucrose:
0.62 g
Glucose:
0.73 g
Fructose:
0.47 g
Lactose:
0 g
Maltose:
0.01 g
Galactose:
0 g
4
22%
46%
28%
4%
Starch:
0 g
Sucrose:
0.91 g
Glucose:
1.9 g
Fructose:
1.13 g
Lactose:
0 g
Maltose:
0 g
Galactose:
0.15 g
Contains
more
Starch Starch
+∞%
Contains
more
Maltose Maltose
+∞%
Contains
more
Sucrose Sucrose
+46.8%
Contains
more
Glucose Glucose
+160.3%
Contains
more
Fructose Fructose
+140.4%
Contains
more
Galactose Galactose
+∞%