Teff vs. Spelt — In-Depth Nutrition Comparison
Compare
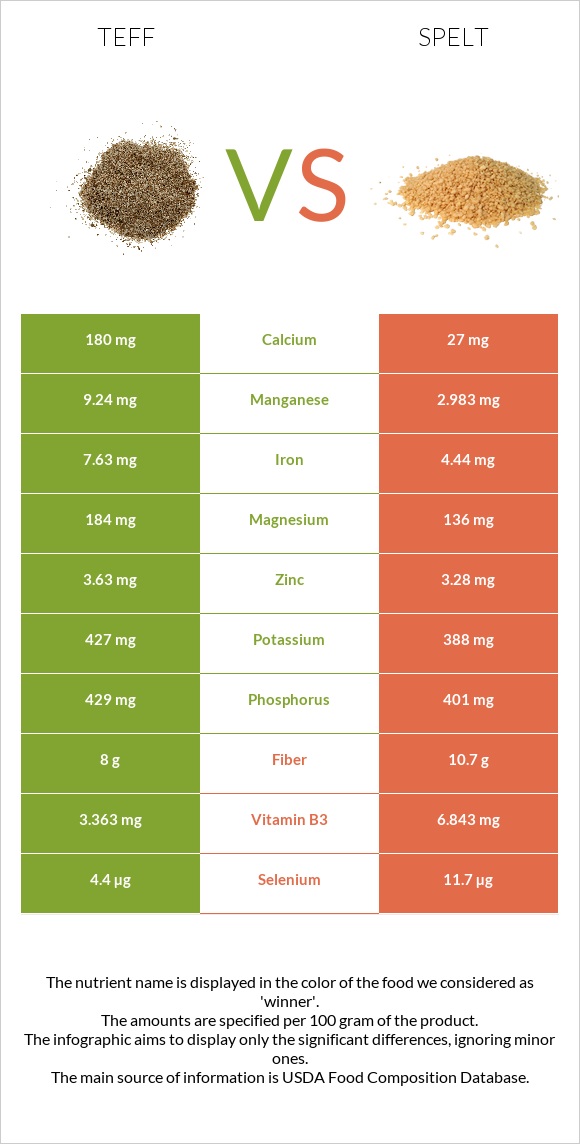
Important differences between teff and spelt
- Teff has more manganese, iron, copper, vitamin B6, calcium, vitamin B2, and magnesium; however, spelt is richer in vitamin B3, selenium, and fiber.
- Teff's daily need coverage for manganese is 272% more.
- Teff contains 7 times more calcium than spelt. Teff contains 180mg of calcium, while spelt contains 27mg.
The food varieties used in the comparison are Teff, uncooked and Spelt, uncooked.
Infographic
Infographic link
Mineral Comparison
Mineral comparison score is based on the number of minerals by which one or the other food is richer. The "coverage" charts below show how much of the daily needs can be covered by 300 grams of the food.
| Contains more MagnesiumMagnesium | +35.3% |
| Contains more CalciumCalcium | +566.7% |
| Contains more IronIron | +71.8% |
| Contains more CopperCopper | +58.5% |
| Contains more ManganeseManganese | +209.8% |
| Contains less SodiumSodium | -33.3% |
| Contains more SeleniumSelenium | +165.9% |
Vitamin Comparison
Vitamin comparison score is based on the number of vitamins by which one or the other food is richer. The "coverage" charts below show how much of the daily needs can be covered by 300 grams of the food.
| Contains more Vitamin B2Vitamin B2 | +138.9% |
| Contains more Vitamin B6Vitamin B6 | +109.6% |
| Contains more Vitamin EVitamin E | +887.5% |
| Contains more Vitamin B3Vitamin B3 | +103.5% |
| Contains more Vitamin B5Vitamin B5 | +13.4% |
| Contains more Vitamin KVitamin K | +89.5% |
All nutrients comparison - raw data values
| Nutrient |  |
 |
DV% diff. |
| Manganese | 9.24mg | 2.983mg | 272% |
| Iron | 7.63mg | 4.44mg | 40% |
| Copper | 0.81mg | 0.511mg | 33% |
| Vitamin B3 | 3.363mg | 6.843mg | 22% |
| Vitamin B6 | 0.482mg | 0.23mg | 19% |
| Calcium | 180mg | 27mg | 15% |
| Selenium | 4.4µg | 11.7µg | 13% |
| Vitamin B2 | 0.27mg | 0.113mg | 12% |
| Magnesium | 184mg | 136mg | 11% |
| Fiber | 8g | 10.7g | 11% |
| Folate | 45µg | 11% | |
| Starch | 36.56g | 53.92g | 7% |
| Vitamin E | 0.08mg | 0.79mg | 5% |
| Phosphorus | 429mg | 401mg | 4% |
| Protein | 13.3g | 14.57g | 3% |
| Zinc | 3.63mg | 3.28mg | 3% |
| Vitamin B5 | 0.942mg | 1.068mg | 3% |
| Vitamin B1 | 0.39mg | 0.364mg | 2% |
| Choline | 13.1mg | 2% | |
| Calories | 367kcal | 338kcal | 1% |
| Carbs | 73.13g | 70.19g | 1% |
| Potassium | 427mg | 388mg | 1% |
| Vitamin K | 1.9µg | 3.6µg | 1% |
| Polyunsaturated fat | 1.071g | 1.258g | 1% |
| Protein per 100 calories | 3.6g | 4.3g | N/A |
| Calories per 10 g protein | 276kcal | 232kcal | N/A |
| Weight per 100 calories | 27g | 30g | N/A |
| Fats | 2.38g | 2.43g | 0% |
| Unsaturated / Saturated Fat ratio | 3.7 | 4.2 | N/A |
| Net carbs | 65.13g | 59.49g | N/A |
| Sugar | 1.84g | 6.82g | N/A |
| Sodium | 12mg | 8mg | 0% |
| Saturated fat | 0.449g | 0.406g | 0% |
| Monounsaturated fat | 0.589g | 0.445g | 0% |
| Tryptophan | 0.139mg | 0.132mg | 0% |
| Threonine | 0.51mg | 0.443mg | 0% |
| Isoleucine | 0.501mg | 0.552mg | 0% |
| Leucine | 1.068mg | 1.07mg | 0% |
| Lysine | 0.376mg | 0.409mg | 0% |
| Methionine | 0.428mg | 0.258mg | 0% |
| Phenylalanine | 0.698mg | 0.737mg | 0% |
| Valine | 0.686mg | 0.681mg | 0% |
| Histidine | 0.301mg | 0.36mg | 0% |
| Fructose | 0.47g | 0.24g | 0% |
| Omega-3 - ALA | 0.135g | 0.065g | N/A |
Macronutrient Comparison
Macronutrient breakdown side-by-side comparison
| Contains more OtherOther | +32.4% |
| Contains more WaterWater | +24.9% |
~equal in
Protein
~14.57g
~equal in
Fats
~2.43g
~equal in
Carbs
~70.19g
Fat Type Comparison
Fat type breakdown side-by-side comparison
| Contains more Mono. FatMonounsaturated fat | +32.4% |
| Contains more Poly. FatPolyunsaturated fat | +17.5% |
~equal in
Saturated fat
~0.406g
Carbohydrate type comparison
Carbohydrate type breakdown side-by-side comparison
| Contains more FructoseFructose | +95.8% |
| Contains more StarchStarch | +47.5% |
| Contains more GlucoseGlucose | +15.1% |
| Contains more MaltoseMaltose | +51400% |
~equal in
Sucrose
~0.59g
~equal in
Lactose
~0g
~equal in
Galactose
~0g