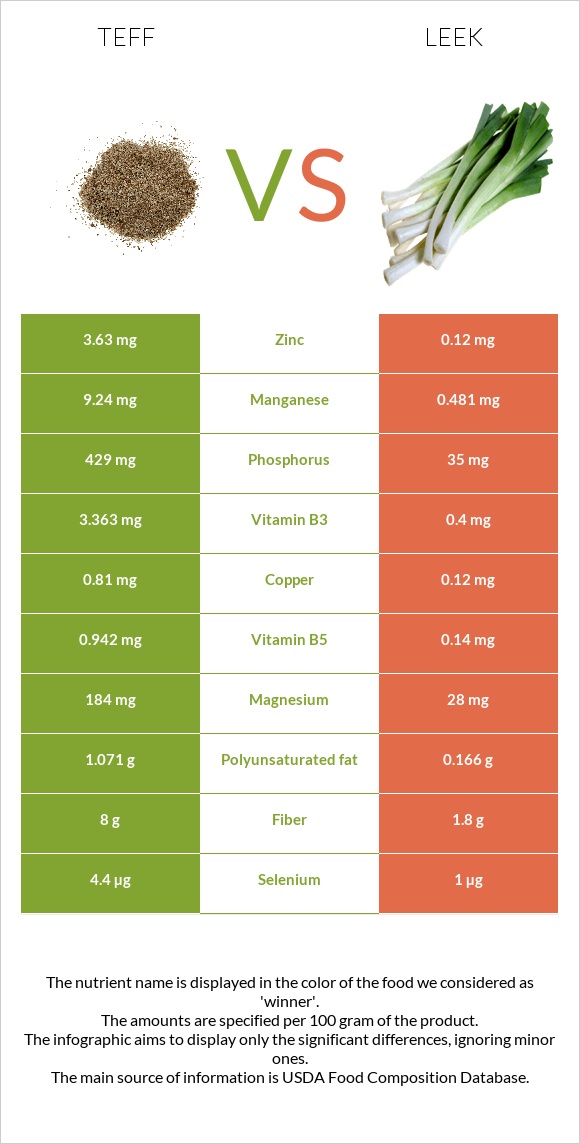
How are teff and leeks different? Teff is higher in manganese, phosphorus, copper, vitamin B1, zinc, and magnesium; however, leeks are richer in vitamin A, folate, and vitamin B6. Daily need coverage for manganese for teff is 103% higher. Teff contains 9 times more zinc than leeks. While teff contains 1.11mg of zinc, leeks contain only 0.12mg. Leeks have a lower glycemic index (32) than teff (57). Teff, cooked and Leeks, (bulb and lower leaf-portion), raw are the varieties used in this article.
Infographic
Mineral Comparison
Mineral comparison score is based on the number of minerals by which one or the other food is richer. The "coverage" charts below show how much of the daily needs can be covered by 300 grams of the food.
6
100 g
300 g
1 cup - 252g
Magnesium
Magnesium
Calcium
Calcium
Potassium
Potassium
Iron
Iron
Copper
Copper
Zinc
Zinc
Phosphorus
Phosphorus
Sodium
Sodium
Manganese
Manganese
Selenium
Selenium
36%
15%
9.4%
77%
75%
30%
51%
1%
373%
0%
3
100 g
300 g
1 slice - 6g 1 cup - 89g 1 leek - 89g
Magnesium
Magnesium
Calcium
Calcium
Potassium
Potassium
Iron
Iron
Copper
Copper
Zinc
Zinc
Phosphorus
Phosphorus
Sodium
Sodium
Manganese
Manganese
Selenium
Selenium
20%
18%
16%
79%
40%
3.3%
15%
2.6%
63%
5.5%
Vitamin Comparison
Vitamin comparison score is based on the number of vitamins by which one or the other food is richer. The "coverage" charts below show how much of the daily needs can be covered by 300 grams of the food.
2
100 g
300 g
1 cup - 252g
Vitamin C
Vit. C
Vitamin D
Vit. D
Vitamin A
Vit. A
Vitamin E
Vit. E
Vitamin B1
Vit. B1
Vitamin B2
Vit. B2
Vitamin B3
Vit. B3
Vitamin B5
Vit. B5
Vitamin B6
Vit. B6
Vitamin B12
Vit. B12
Vitamin K
Vit. K
Folate
Folate
0%
0%
0%
0%
46%
7.6%
17%
0%
22%
0%
0%
14%
7
100 g
300 g
1 slice - 6g 1 cup - 89g 1 leek - 89g
Vitamin C
Vit. C
Vitamin D
Vit. D
Vitamin A
Vit. A
Vitamin E
Vit. E
Vitamin B1
Vit. B1
Vitamin B2
Vit. B2
Vitamin B3
Vit. B3
Vitamin B5
Vit. B5
Vitamin B6
Vit. B6
Vitamin B12
Vit. B12
Vitamin K
Vit. K
Folate
Folate
40%
0%
28%
18%
15%
6.9%
7.5%
8.4%
54%
0%
118%
48%
All nutrients comparison - raw data values
Nutrient
DV% diff.
Manganese
2.86mg
0.481mg
103%
Vitamin K
47µg
39%
Vitamin C
12mg
13%
Copper
0.226mg
0.12mg
12%
Phosphorus
120mg
35mg
12%
Folate
18µg
64µg
12%
Vitamin B1
0.183mg
0.06mg
10%
Vitamin B6
0.097mg
0.233mg
10%
Zinc
1.11mg
0.12mg
9%
Vitamin A
0µg
83µg
9%
Vitamin E
0.92mg
6%
Protein
3.87g
1.5g
5%
Magnesium
50mg
28mg
5%
Fiber
2.8g
1.8g
4%
Vitamin B3
0.909mg
0.4mg
3%
Vitamin B5
0.14mg
3%
Calories
101kcal
61kcal
2%
Carbs
19.86g
14.15g
2%
Potassium
107mg
180mg
2%
Selenium
1µg
2%
Choline
9.5mg
2%
Fats
0.65g
0.3g
1%
Calcium
49mg
59mg
1%
Iron
2.05mg
2.1mg
1%
Sodium
8mg
20mg
1%
Polyunsaturated fat
0.166g
1%
Protein per 100 calories
3.8g
2.5g
N/A
Calories per 10 g protein
261kcal
407kcal
N/A
Weight per 100 calories
99g
164g
N/A
Net carbs
17.06g
12.35g
N/A
Sugar
3.9g
N/A
Vitamin B2
0.033mg
0.03mg
0%
Saturated fat
0.04g
0%
Monounsaturated fat
0.004g
0%
Tryptophan
0.041mg
0.012mg
0%
Threonine
0.149mg
0.063mg
0%
Isoleucine
0.146mg
0.052mg
0%
Leucine
0.311mg
0.096mg
0%
Lysine
0.109mg
0.078mg
0%
Methionine
0.125mg
0.018mg
0%
Phenylalanine
0.203mg
0.055mg
0%
Valine
0.2mg
0.056mg
0%
Histidine
0.088mg
0.025mg
0%
Macronutrient Comparison
Macronutrient breakdown side-by-side comparison
3
4%
20%
75%
Protein:
3.87 g
Fats:
0.65 g
Carbs:
19.86 g
Water:
74.93 g
Other:
0.69 g
2
14%
83%
Protein:
1.5 g
Fats:
0.3 g
Carbs:
14.15 g
Water:
83 g
Other:
1.05 g
Contains
more
Protein Protein
+158%
Contains
more
Fats Fats
+116.7%
Contains
more
Carbs Carbs
+40.4%
Contains
more
Water Water
+10.8%
Contains
more
Other Other
+52.2%