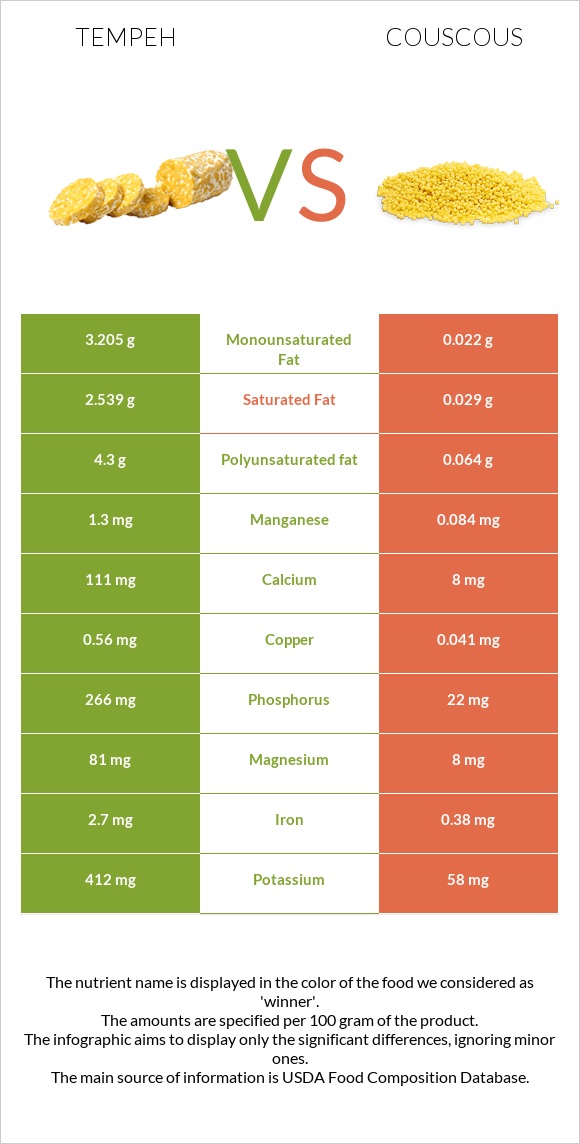
Summary of differences between tempeh and couscous Tempeh has more copper, manganese, phosphorus, iron, vitamin B2, magnesium, vitamin B6, and potassium; however, couscous is higher in selenium. Tempeh covers your daily need for copper, 58% more than couscous. Tempeh has 88 times more saturated fat than couscous. While tempeh has 2.539g of saturated fat, couscous has only 0.029g. The glycemic index of couscous is higher. These are the specific foods used in this comparison Tempeh and Couscous, cooked .
Infographic
Mineral Comparison
Mineral comparison score is based on the number of minerals by which one or the other food is richer. The "coverage" charts below show how much of the daily needs can be covered by 300 grams of the food.
8
100 g
300 g
1 cup - 166g
Magnesium
Magnesium
Calcium
Calcium
Potassium
Potassium
Iron
Iron
Copper
Copper
Zinc
Zinc
Phosphorus
Phosphorus
Sodium
Sodium
Manganese
Manganese
Selenium
Selenium
58%
33%
36%
101%
187%
31%
114%
1.2%
170%
0%
2
100 g
300 g
1 oz, dry, yields - 86g 1 cup, cooked - 157g 1 cup, dry, yields - 528g
Magnesium
Magnesium
Calcium
Calcium
Potassium
Potassium
Iron
Iron
Copper
Copper
Zinc
Zinc
Phosphorus
Phosphorus
Sodium
Sodium
Manganese
Manganese
Selenium
Selenium
5.7%
2.4%
5.1%
14%
14%
7.1%
9.4%
0.65%
11%
150%
Vitamin Comparison
Vitamin comparison score is based on the number of vitamins by which one or the other food is richer. The "coverage" charts below show how much of the daily needs can be covered by 300 grams of the food.
6
100 g
300 g
1 cup - 166g
Vitamin C
Vit. C
Vitamin D
Vit. D
Vitamin A
Vit. A
Vitamin E
Vit. E
Vitamin B1
Vit. B1
Vitamin B2
Vit. B2
Vitamin B3
Vit. B3
Vitamin B5
Vit. B5
Vitamin B6
Vit. B6
Vitamin B12
Vit. B12
Vitamin K
Vit. K
Folate
Folate
0%
0%
0%
0%
20%
83%
50%
17%
50%
10%
0%
18%
3
100 g
300 g
1 oz, dry, yields - 86g 1 cup, cooked - 157g 1 cup, dry, yields - 528g
Vitamin C
Vit. C
Vitamin D
Vit. D
Vitamin A
Vit. A
Vitamin E
Vit. E
Vitamin B1
Vit. B1
Vitamin B2
Vit. B2
Vitamin B3
Vit. B3
Vitamin B5
Vit. B5
Vitamin B6
Vit. B6
Vitamin B12
Vit. B12
Vitamin K
Vit. K
Folate
Folate
0%
0%
0%
2.6%
16%
6.2%
18%
22%
12%
0%
0.25%
11%
All nutrients comparison - raw data values
Nutrient
DV% diff.
Copper
0.56mg
0.041mg
58%
Manganese
1.3mg
0.084mg
53%
Selenium
0µg
27.5µg
50%
Phosphorus
266mg
22mg
35%
Protein
20.29g
3.79g
33%
Iron
2.7mg
0.38mg
29%
Polyunsaturated fat
4.3g
0.064g
28%
Vitamin B2
0.358mg
0.027mg
25%
Magnesium
81mg
8mg
17%
Fats
10.8g
0.16g
16%
Vitamin B6
0.215mg
0.051mg
13%
Saturated fat
2.539g
0.029g
11%
Calcium
111mg
8mg
10%
Potassium
412mg
58mg
10%
Vitamin B3
2.64mg
0.983mg
10%
Zinc
1.14mg
0.26mg
8%
Monounsaturated fat
3.205g
0.022g
8%
Fiber
1.4g
6%
Carbs
7.64g
23.22g
5%
Calories
192kcal
112kcal
4%
Vitamin B12
0.08µg
0µg
3%
Vitamin B5
0.278mg
0.371mg
2%
Folate
24µg
15µg
2%
Vitamin E
0.13mg
1%
Vitamin B1
0.078mg
0.063mg
1%
Choline
3.3mg
1%
Protein per 100 calories
11g
3.4g
N/A
Calories per 10 g protein
95kcal
296kcal
N/A
Weight per 100 calories
52g
89g
N/A
Unsaturated / Saturated Fat ratio
3
3
N/A
Net carbs
7.64g
21.82g
N/A
Sugar
0.1g
N/A
Sodium
9mg
5mg
0%
Vitamin K
0.1µg
0%
Tryptophan
0.194mg
0.049mg
0%
Threonine
0.796mg
0.1mg
0%
Isoleucine
0.88mg
0.147mg
0%
Leucine
1.43mg
0.259mg
0%
Lysine
0.908mg
0.073mg
0%
Methionine
0.175mg
0.059mg
0%
Phenylalanine
0.893mg
0.184mg
0%
Valine
0.92mg
0.162mg
0%
Histidine
0.466mg
0.077mg
0%
Macronutrient Comparison
Macronutrient breakdown side-by-side comparison
3
20%
11%
8%
60%
Protein:
20.29 g
Fats:
10.8 g
Carbs:
7.64 g
Water:
59.65 g
Other:
1.62 g
2
4%
23%
73%
Protein:
3.79 g
Fats:
0.16 g
Carbs:
23.22 g
Water:
72.57 g
Other:
0.26 g
Contains
more
Protein Protein
+435.4%
Contains
more
Fats Fats
+6650%
Contains
more
Other Other
+523.1%
Contains
more
Carbs Carbs
+203.9%
Contains
more
Water Water
+21.7%
Fat Type Comparison
Fat type breakdown side-by-side comparison
2
25%
32%
43%
Saturated fat:
Sat. Fat
2.539 g
Monounsaturated fat:
Mono. Fat
3.205 g
Polyunsaturated fat:
Poly. Fat
4.3 g
1
25%
19%
56%
Saturated fat:
Sat. Fat
0.029 g
Monounsaturated fat:
Mono. Fat
0.022 g
Polyunsaturated fat:
Poly. Fat
0.064 g
Contains
more
Mono. Fat Monounsaturated fat
+14468.2%
Contains
more
Poly. Fat Polyunsaturated fat
+6618.8%
Contains
less
Sat. Fat Saturated fat
-98.9%