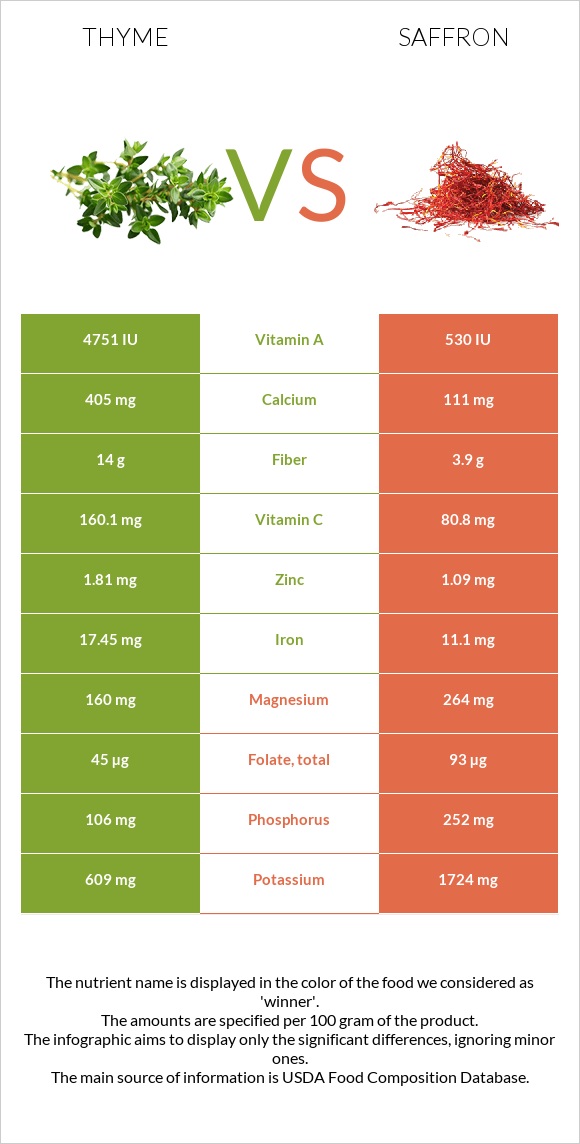
What are the main differences between thyme and saffron? Thyme is richer in vitamin C, vitamin A, iron, fiber, calcium, and copper, while saffron is higher in manganese, vitamin B6, potassium, and magnesium. Saffron's daily need coverage for manganese is 1160% higher. Saffron has 9 times less vitamin A than thyme. Thyme has 4751 IU of vitamin A, while saffron has 530 IU. Saffron has a higher glycemic index (70) than thyme (45). We used Thyme, fresh and Spices, saffron types in this comparison.
Infographic
Mineral Comparison
Mineral comparison score is based on the number of minerals by which one or the other food is richer. The "coverage" charts below show how much of the daily needs can be covered by 300 grams of the food.
5
100 g
300 g
0.5 tsp - 0.4g 1 tsp - 0.8g
Magnesium
Magnesium
Calcium
Calcium
Potassium
Potassium
Iron
Iron
Copper
Copper
Zinc
Zinc
Phosphorus
Phosphorus
Sodium
Sodium
Manganese
Manganese
Selenium
Selenium
114%
122%
54%
654%
185%
49%
45%
1.2%
224%
0%
5
100 g
300 g
0.25 tsp - 0.5g 1 tbsp - 2.1g
Magnesium
Magnesium
Calcium
Calcium
Potassium
Potassium
Iron
Iron
Copper
Copper
Zinc
Zinc
Phosphorus
Phosphorus
Sodium
Sodium
Manganese
Manganese
Selenium
Selenium
189%
33%
152%
416%
109%
30%
108%
19%
3705%
31%
Vitamin Comparison
Vitamin comparison score is based on the number of vitamins by which one or the other food is richer. The "coverage" charts below show how much of the daily needs can be covered by 300 grams of the food.
5
100 g
300 g
0.5 tsp - 0.4g 1 tsp - 0.8g
Vitamin C
Vit. C
Vitamin D
Vit. D
Vitamin A
Vit. A
Vitamin E
Vit. E
Vitamin B1
Vit. B1
Vitamin B2
Vit. B2
Vitamin B3
Vit. B3
Vitamin B5
Vit. B5
Vitamin B6
Vit. B6
Vitamin B12
Vit. B12
Vitamin K
Vit. K
Folate
Folate
534%
0%
79%
0%
12%
109%
34%
25%
80%
0%
0%
34%
3
100 g
300 g
0.25 tsp - 0.5g 1 tbsp - 2.1g
Vitamin C
Vit. C
Vitamin D
Vit. D
Vitamin A
Vit. A
Vitamin E
Vit. E
Vitamin B1
Vit. B1
Vitamin B2
Vit. B2
Vitamin B3
Vit. B3
Vitamin B5
Vit. B5
Vitamin B6
Vit. B6
Vitamin B12
Vit. B12
Vitamin K
Vit. K
Folate
Folate
269%
0%
9%
0%
29%
62%
27%
0%
233%
0%
0%
70%
All nutrients comparison - raw data values
Nutrient
DV% diff.
Manganese
1.719mg
28.408mg
1160%
Vitamin C
160.1mg
80.8mg
88%
Iron
17.45mg
11.1mg
79%
Vitamin B6
0.348mg
1.01mg
51%
Fiber
14g
3.9g
40%
Potassium
609mg
1724mg
33%
Calcium
405mg
111mg
29%
Magnesium
160mg
264mg
25%
Copper
0.555mg
0.328mg
25%
Vitamin A
238µg
27µg
23%
Phosphorus
106mg
252mg
21%
Vitamin B2
0.471mg
0.267mg
16%
Carbs
24.45g
65.37g
14%
Protein
5.56g
11.43g
12%
Folate
45µg
93µg
12%
Calories
101kcal
310kcal
10%
Selenium
5.6µg
10%
Polyunsaturated fat
0.532g
2.067g
10%
Vitamin B5
0.409mg
8%
Zinc
1.81mg
1.09mg
7%
Fats
1.68g
5.85g
6%
Sodium
9mg
148mg
6%
Vitamin B1
0.048mg
0.115mg
6%
Saturated fat
0.467g
1.586g
5%
Vitamin B3
1.824mg
1.46mg
2%
Monounsaturated fat
0.081g
0.429g
1%
Protein per 100 calories
5.5g
3.7g
N/A
Calories per 10 g protein
182kcal
271kcal
N/A
Weight per 100 calories
99g
32g
N/A
Unsaturated / Saturated Fat ratio
1.3
1.6
N/A
Net carbs
10.45g
61.47g
N/A
Tryptophan
0.114mg
0%
Threonine
0.154mg
0%
Isoleucine
0.285mg
0%
Leucine
0.262mg
0%
Lysine
0.126mg
0%
Valine
0.307mg
0%
Omega-3 - DPA
0.006g
N/A
Macronutrient Comparison
Macronutrient breakdown side-by-side comparison
1
6%
2%
24%
65%
3%
Protein:
5.56 g
Fats:
1.68 g
Carbs:
24.45 g
Water:
65.11 g
Other:
3.2 g
4
11%
6%
65%
12%
5%
Protein:
11.43 g
Fats:
5.85 g
Carbs:
65.37 g
Water:
11.9 g
Other:
5.45 g
Contains
more
Water Water
+447.1%
Contains
more
Protein Protein
+105.6%
Contains
more
Fats Fats
+248.2%
Contains
more
Carbs Carbs
+167.4%
Contains
more
Other Other
+70.3%
Fat Type Comparison
Fat type breakdown side-by-side comparison
1
43%
8%
49%
Saturated fat:
Sat. Fat
0.467 g
Monounsaturated fat:
Mono. Fat
0.081 g
Polyunsaturated fat:
Poly. Fat
0.532 g
2
39%
11%
51%
Saturated fat:
Sat. Fat
1.586 g
Monounsaturated fat:
Mono. Fat
0.429 g
Polyunsaturated fat:
Poly. Fat
2.067 g
Contains
less
Sat. Fat Saturated fat
-70.6%
Contains
more
Mono. Fat Monounsaturated fat
+429.6%
Contains
more
Poly. Fat Polyunsaturated fat
+288.5%