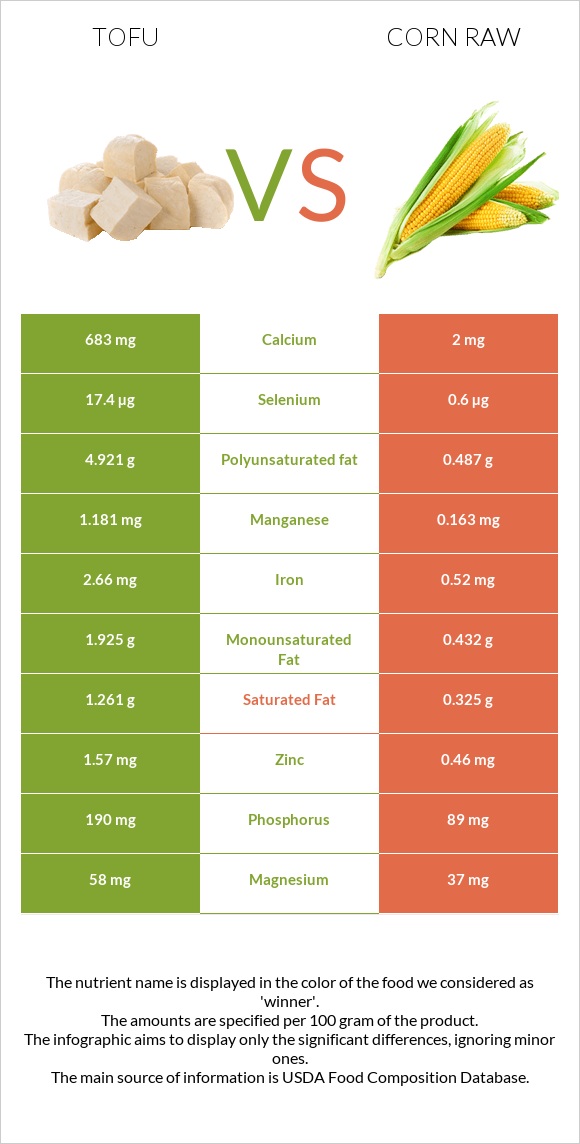
Summary of differences between tofu and corn raw Tofu has more calcium, manganese, copper, selenium, iron, phosphorus, and zinc; however, corn raw is higher in vitamin B5, vitamin B3, and vitamin C. Tofu covers your daily need for calcium, 68% more than corn raw. Tofu has 29 times more selenium than corn raw. While tofu has 17.4µg of selenium, corn raw has only 0.6µg. The glycemic index of corn raw is higher. These are the specific foods used in this comparison Tofu, raw, firm, prepared with calcium sulfate and Corn, sweet, yellow, raw .
Infographic
Mineral Comparison
Mineral comparison score is based on the number of minerals by which one or the other food is richer. The "coverage" charts below show how much of the daily needs can be covered by 300 grams of the food.
8
100 g
300 g
0.25 block - 81g 0.5 cup - 126g
Magnesium
Magnesium
Calcium
Calcium
Potassium
Potassium
Iron
Iron
Copper
Copper
Zinc
Zinc
Phosphorus
Phosphorus
Sodium
Sodium
Manganese
Manganese
Selenium
Selenium
41%
205%
21%
100%
126%
43%
81%
1.8%
154%
95%
1
100 g
300 g
1 ear, small (5-1/2" to 6-1/2" long) - 73g 1 ear, medium (6-3/4" to 7-1/2" long) yields - 102g 1 ear, large (7-3/4" to 9" long) yields - 143g 1 cup - 145g
Magnesium
Magnesium
Calcium
Calcium
Potassium
Potassium
Iron
Iron
Copper
Copper
Zinc
Zinc
Phosphorus
Phosphorus
Sodium
Sodium
Manganese
Manganese
Selenium
Selenium
26%
0.6%
24%
20%
18%
13%
38%
2%
21%
3.3%
Vitamin Comparison
Vitamin comparison score is based on the number of vitamins by which one or the other food is richer. The "coverage" charts below show how much of the daily needs can be covered by 300 grams of the food.
1
100 g
300 g
0.25 block - 81g 0.5 cup - 126g
Vitamin C
Vit. C
Vitamin D
Vit. D
Vitamin A
Vit. A
Vitamin E
Vit. E
Vitamin B1
Vit. B1
Vitamin B2
Vit. B2
Vitamin B3
Vit. B3
Vitamin B5
Vit. B5
Vitamin B6
Vit. B6
Vitamin B12
Vit. B12
Vitamin K
Vit. K
Folate
Folate
0.67%
0%
0%
0%
40%
24%
7.1%
8%
21%
0%
0%
22%
7
100 g
300 g
1 ear, small (5-1/2" to 6-1/2" long) - 73g 1 ear, medium (6-3/4" to 7-1/2" long) yields - 102g 1 ear, large (7-3/4" to 9" long) yields - 143g 1 cup - 145g
Vitamin C
Vit. C
Vitamin D
Vit. D
Vitamin A
Vit. A
Vitamin E
Vit. E
Vitamin B1
Vit. B1
Vitamin B2
Vit. B2
Vitamin B3
Vit. B3
Vitamin B5
Vit. B5
Vitamin B6
Vit. B6
Vitamin B12
Vit. B12
Vitamin K
Vit. K
Folate
Folate
23%
0%
3%
1.4%
39%
13%
33%
43%
21%
0%
0.75%
32%
All nutrients comparison - raw data values
Nutrient
DV% diff.
Calcium
683mg
2mg
68%
Manganese
1.181mg
0.163mg
44%
Copper
0.378mg
0.054mg
36%
Selenium
17.4µg
0.6µg
31%
Polyunsaturated fat
4.921g
0.487g
30%
Protein
17.27g
3.27g
28%
Iron
2.66mg
0.52mg
27%
Phosphorus
190mg
89mg
14%
Vitamin B5
0.133mg
0.717mg
12%
Fats
8.72g
1.35g
11%
Zinc
1.57mg
0.46mg
10%
Vitamin B3
0.381mg
1.77mg
9%
Vitamin C
0.2mg
6.8mg
7%
Carbs
2.78g
18.7g
5%
Magnesium
58mg
37mg
5%
Vitamin B2
0.102mg
0.055mg
4%
Choline
23mg
4%
Saturated fat
1.261g
0.325g
4%
Monounsaturated fat
1.925g
0.432g
4%
Calories
144kcal
86kcal
3%
Folate
29µg
42µg
3%
Starch
5.7g
2%
Fructose
1.94g
2%
Potassium
237mg
270mg
1%
Fiber
2.3g
2g
1%
Vitamin A
9µg
1%
Protein per 100 calories
12g
3.8g
N/A
Calories per 10 g protein
83kcal
263kcal
N/A
Weight per 100 calories
69g
116g
N/A
Unsaturated / Saturated Fat ratio
5.4
2.8
N/A
Net carbs
0.48g
16.7g
N/A
Sugar
6.26g
N/A
Sodium
14mg
15mg
0%
Vitamin E
0.07mg
0%
Vitamin B1
0.158mg
0.155mg
0%
Vitamin B6
0.092mg
0.093mg
0%
Vitamin K
0.3µg
0%
Tryptophan
0.235mg
0.023mg
0%
Threonine
0.785mg
0.129mg
0%
Isoleucine
0.849mg
0.129mg
0%
Leucine
1.392mg
0.348mg
0%
Lysine
0.883mg
0.137mg
0%
Methionine
0.211mg
0.067mg
0%
Phenylalanine
0.835mg
0.15mg
0%
Valine
0.87mg
0.185mg
0%
Histidine
0.431mg
0.089mg
0%
Omega-3 - ALA
0.014g
N/A
Omega-6 - Linoleic acid
0.468g
N/A
Macronutrient Comparison
Macronutrient breakdown side-by-side comparison
3
17%
9%
3%
70%
Protein:
17.27 g
Fats:
8.72 g
Carbs:
2.78 g
Water:
69.83 g
Other:
1.4 g
2
3%
19%
76%
Protein:
3.27 g
Fats:
1.35 g
Carbs:
18.7 g
Water:
76.05 g
Other:
0.63 g
Contains
more
Protein Protein
+428.1%
Contains
more
Fats Fats
+545.9%
Contains
more
Other Other
+122.2%
Contains
more
Carbs Carbs
+572.7%
Fat Type Comparison
Fat type breakdown side-by-side comparison
2
16%
24%
61%
Saturated fat:
Sat. Fat
1.261 g
Monounsaturated fat:
Mono. Fat
1.925 g
Polyunsaturated fat:
Poly. Fat
4.921 g
1
26%
35%
39%
Saturated fat:
Sat. Fat
0.325 g
Monounsaturated fat:
Mono. Fat
0.432 g
Polyunsaturated fat:
Poly. Fat
0.487 g
Contains
more
Mono. Fat Monounsaturated fat
+345.6%
Contains
more
Poly. Fat Polyunsaturated fat
+910.5%
Contains
less
Sat. Fat Saturated fat
-74.2%