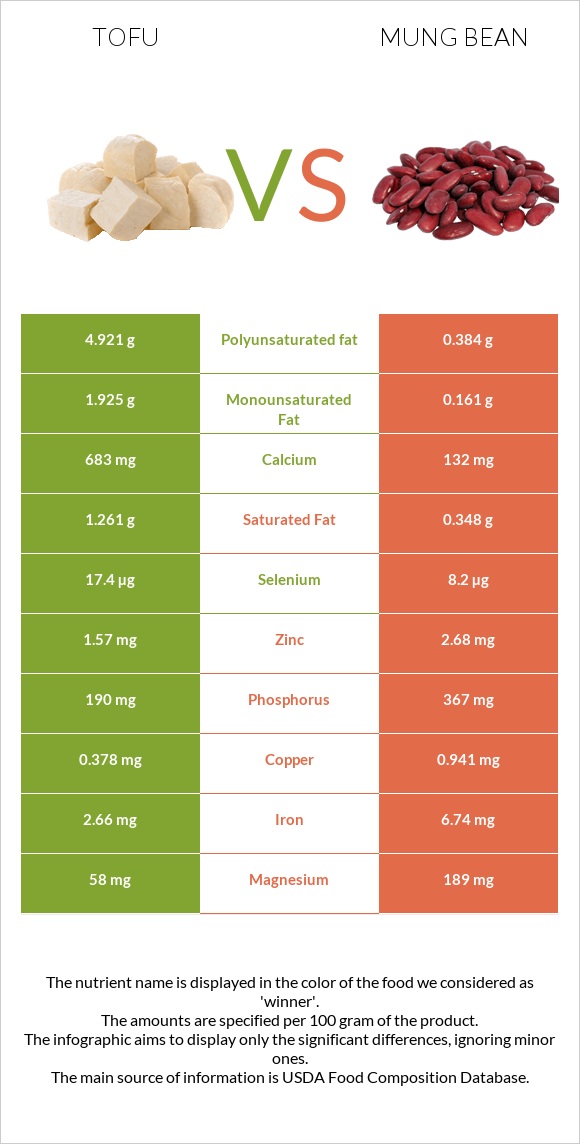
What are the main differences between tofu and mung beans? Tofu is richer in calcium, yet mung beans are richer in folate, copper, fiber, iron, vitamin B1, vitamin B5, magnesium, potassium, and phosphorus. Mung beans' daily need coverage for folate is 149% higher. Tofu has 5 times more calcium than mung beans. Tofu has 683mg of calcium, while mung beans have 132mg. Tofu has a lower glycemic index than mung beans. We used Tofu, raw, firm, prepared with calcium sulfate and Mung beans, mature seeds, raw types in this comparison.
Infographic
Mineral Comparison
Mineral comparison score is based on the number of minerals by which one or the other food is richer. The "coverage" charts below show how much of the daily needs can be covered by 300 grams of the food.
3
100 g
300 g
0.25 block - 81g 0.5 cup - 126g
Magnesium
Magnesium
Calcium
Calcium
Potassium
Potassium
Iron
Iron
Copper
Copper
Zinc
Zinc
Phosphorus
Phosphorus
Sodium
Sodium
Manganese
Manganese
Selenium
Selenium
41%
205%
21%
100%
126%
43%
81%
1.8%
154%
95%
6
100 g
300 g
1 tbsp - 13g 1 cup - 207g
Magnesium
Magnesium
Calcium
Calcium
Potassium
Potassium
Iron
Iron
Copper
Copper
Zinc
Zinc
Phosphorus
Phosphorus
Sodium
Sodium
Manganese
Manganese
Selenium
Selenium
135%
40%
110%
253%
314%
73%
157%
2%
135%
45%
Vitamin Comparison
Vitamin comparison score is based on the number of vitamins by which one or the other food is richer. The "coverage" charts below show how much of the daily needs can be covered by 300 grams of the food.
0
100 g
300 g
0.25 block - 81g 0.5 cup - 126g
Vitamin C
Vit. C
Vitamin D
Vit. D
Vitamin A
Vit. A
Vitamin E
Vit. E
Vitamin B1
Vit. B1
Vitamin B2
Vit. B2
Vitamin B3
Vit. B3
Vitamin B5
Vit. B5
Vitamin B6
Vit. B6
Vitamin B12
Vit. B12
Vitamin K
Vit. K
Folate
Folate
0.67%
0%
0%
0%
40%
24%
7.1%
8%
21%
0%
0%
22%
10
100 g
300 g
1 tbsp - 13g 1 cup - 207g
Vitamin C
Vit. C
Vitamin D
Vit. D
Vitamin A
Vit. A
Vitamin E
Vit. E
Vitamin B1
Vit. B1
Vitamin B2
Vit. B2
Vitamin B3
Vit. B3
Vitamin B5
Vit. B5
Vitamin B6
Vit. B6
Vitamin B12
Vit. B12
Vitamin K
Vit. K
Folate
Folate
16%
0%
2%
10%
155%
54%
42%
115%
88%
0%
23%
469%
All nutrients comparison - raw data values
Nutrient
DV% diff.
Folate
29µg
625µg
149%
Copper
0.378mg
0.941mg
63%
Fiber
2.3g
16.3g
56%
Calcium
683mg
132mg
55%
Iron
2.66mg
6.74mg
51%
Vitamin B1
0.158mg
0.621mg
39%
Vitamin B5
0.133mg
1.91mg
36%
Magnesium
58mg
189mg
31%
Potassium
237mg
1246mg
30%
Polyunsaturated fat
4.921g
0.384g
30%
Phosphorus
190mg
367mg
25%
Vitamin B6
0.092mg
0.382mg
22%
Carbs
2.78g
62.62g
20%
Choline
97.9mg
18%
Selenium
17.4µg
8.2µg
17%
Protein
17.27g
23.86g
13%
Fats
8.72g
1.15g
12%
Vitamin B3
0.381mg
2.251mg
12%
Calories
144kcal
347kcal
10%
Zinc
1.57mg
2.68mg
10%
Vitamin B2
0.102mg
0.233mg
10%
Vitamin K
9µg
8%
Manganese
1.181mg
1.035mg
6%
Vitamin C
0.2mg
4.8mg
5%
Saturated fat
1.261g
0.348g
4%
Monounsaturated fat
1.925g
0.161g
4%
Vitamin E
0.51mg
3%
Vitamin A
6µg
1%
Protein per 100 calories
12g
6.9g
N/A
Calories per 10 g protein
83kcal
145kcal
N/A
Weight per 100 calories
69g
29g
N/A
Unsaturated / Saturated Fat ratio
5.4
1.6
N/A
Net carbs
0.48g
46.32g
N/A
Sugar
6.6g
N/A
Sodium
14mg
15mg
0%
Tryptophan
0.235mg
0.26mg
0%
Threonine
0.785mg
0.782mg
0%
Isoleucine
0.849mg
1.008mg
0%
Leucine
1.392mg
1.847mg
0%
Lysine
0.883mg
1.664mg
0%
Methionine
0.211mg
0.286mg
0%
Phenylalanine
0.835mg
1.443mg
0%
Valine
0.87mg
1.237mg
0%
Histidine
0.431mg
0.695mg
0%
Macronutrient Comparison
Macronutrient breakdown side-by-side comparison
2
17%
9%
3%
70%
Protein:
17.27 g
Fats:
8.72 g
Carbs:
2.78 g
Water:
69.83 g
Other:
1.4 g
3
24%
63%
9%
3%
Protein:
23.86 g
Fats:
1.15 g
Carbs:
62.62 g
Water:
9.05 g
Other:
3.32 g
Contains
more
Fats Fats
+658.3%
Contains
more
Water Water
+671.6%
Contains
more
Protein Protein
+38.2%
Contains
more
Carbs Carbs
+2152.5%
Contains
more
Other Other
+137.1%
Fat Type Comparison
Fat type breakdown side-by-side comparison
2
16%
24%
61%
Saturated fat:
Sat. Fat
1.261 g
Monounsaturated fat:
Mono. Fat
1.925 g
Polyunsaturated fat:
Poly. Fat
4.921 g
1
39%
18%
43%
Saturated fat:
Sat. Fat
0.348 g
Monounsaturated fat:
Mono. Fat
0.161 g
Polyunsaturated fat:
Poly. Fat
0.384 g
Contains
more
Mono. Fat Monounsaturated fat
+1095.7%
Contains
more
Poly. Fat Polyunsaturated fat
+1181.5%
Contains
less
Sat. Fat Saturated fat
-72.4%