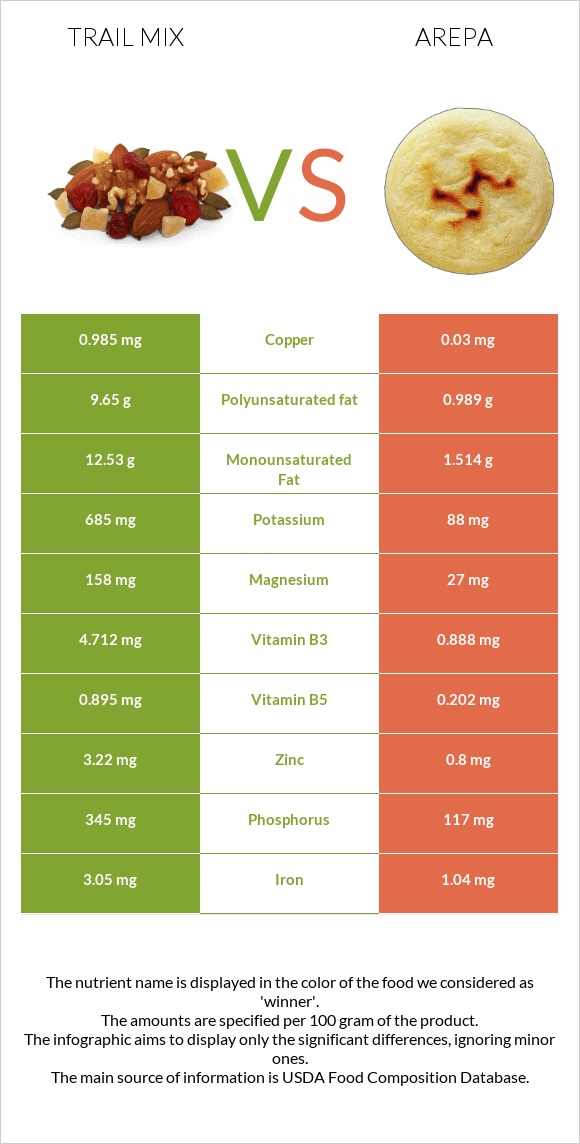
The main differences between trail mix and arepa Trail mix is richer than arepa in copper, manganese, vitamin B1, phosphorus, magnesium, iron, vitamin B3, zinc, potassium, and vitamin B6. Daily need coverage for copper for trail mix is 106% higher. Trail mix contains 9 times more manganese than arepa. Trail mix contains 1.034mg of manganese, while arepa contains 0.116mg. Trail mix has a lower glycemic index than arepa. Food types used in this article are Snacks, trail mix, regular and Restaurant, Latino, arepa (unleavened cornmeal bread) .
Infographic
Mineral Comparison
Mineral comparison score is based on the number of minerals by which one or the other food is richer. The "coverage" charts below show how much of the daily needs can be covered by 300 grams of the food.
8
100 g
300 g
1 oz - 28.35g 1.5 oz - 42g 1 cup - 150g
Magnesium
Magnesium
Calcium
Calcium
Potassium
Potassium
Iron
Iron
Copper
Copper
Zinc
Zinc
Phosphorus
Phosphorus
Sodium
Sodium
Manganese
Manganese
Selenium
Selenium
113%
23%
60%
114%
328%
88%
148%
30%
135%
0%
2
100 g
300 g
1 piece - 98g
Magnesium
Magnesium
Calcium
Calcium
Potassium
Potassium
Iron
Iron
Copper
Copper
Zinc
Zinc
Phosphorus
Phosphorus
Sodium
Sodium
Manganese
Manganese
Selenium
Selenium
19%
27%
7.8%
39%
10%
22%
50%
35%
15%
33%
Vitamin Comparison
Vitamin comparison score is based on the number of vitamins by which one or the other food is richer. The "coverage" charts below show how much of the daily needs can be covered by 300 grams of the food.
7
100 g
300 g
1 oz - 28.35g 1.5 oz - 42g 1 cup - 150g
Vitamin C
Vit. C
Vitamin D
Vit. D
Vitamin A
Vit. A
Vitamin E
Vit. E
Vitamin B1
Vit. B1
Vitamin B2
Vit. B2
Vitamin B3
Vit. B3
Vitamin B5
Vit. B5
Vitamin B6
Vit. B6
Vitamin B12
Vit. B12
Vitamin K
Vit. K
Folate
Folate
4.7%
0%
0.33%
0%
116%
46%
88%
54%
69%
0%
0%
53%
3
100 g
300 g
1 piece - 98g
Vitamin C
Vit. C
Vitamin D
Vit. D
Vitamin A
Vit. A
Vitamin E
Vit. E
Vitamin B1
Vit. B1
Vitamin B2
Vit. B2
Vitamin B3
Vit. B3
Vitamin B5
Vit. B5
Vitamin B6
Vit. B6
Vitamin B12
Vit. B12
Vitamin K
Vit. K
Folate
Folate
0%
0%
20%
5.8%
18%
9.7%
17%
12%
25%
0%
8.8%
0%
All nutrients comparison - raw data values
Nutrient
DV% diff.
Copper
0.985mg
0.03mg
106%
Polyunsaturated fat
9.65g
0.989g
58%
Manganese
1.034mg
0.116mg
40%
Fats
29.4g
5.38g
37%
Phosphorus
345mg
117mg
33%
Vitamin B1
0.462mg
0.07mg
33%
Magnesium
158mg
27mg
31%
Monounsaturated fat
12.53g
1.514g
28%
Iron
3.05mg
1.04mg
25%
Vitamin B3
4.712mg
0.888mg
24%
Zinc
3.22mg
0.8mg
22%
Potassium
685mg
88mg
18%
Folate
71µg
18%
Protein
13.8g
5.48g
17%
Vitamin B6
0.298mg
0.107mg
15%
Vitamin B5
0.895mg
0.202mg
14%
Calories
462kcal
219kcal
12%
Vitamin B2
0.198mg
0.042mg
12%
Saturated fat
5.55g
2.902g
12%
Selenium
6.1µg
11%
Fiber
2.6g
10%
Vitamin A
1µg
61µg
7%
Carbs
44.9g
37.14g
3%
Vitamin K
3.5µg
3%
Vitamin C
1.4mg
2%
Cholesterol
0mg
5mg
2%
Sodium
229mg
270mg
2%
Vitamin E
0.29mg
2%
Calcium
78mg
89mg
1%
Choline
4.4mg
1%
Protein per 100 calories
3g
2.5g
N/A
Calories per 10 g protein
335kcal
400kcal
N/A
Weight per 100 calories
22g
46g
N/A
Unsaturated / Saturated Fat ratio
4
0.86
N/A
Net carbs
44.9g
34.54g
N/A
Sugar
0.87g
N/A
Trans fat
0.157g
N/A
Tryptophan
0.166mg
0.048mg
0%
Threonine
0.482mg
0.193mg
0%
Isoleucine
0.515mg
0.207mg
0%
Leucine
0.89mg
0.671mg
0%
Lysine
0.515mg
0.228mg
0%
Methionine
0.202mg
0.131mg
0%
Phenylalanine
0.658mg
0.276mg
0%
Valine
0.658mg
0.276mg
0%
Histidine
0.357mg
0.166mg
0%
Omega-3 - EPA
0.003g
N/A
Omega-3 - ALA
0.065g
N/A
Omega-3 - DPA
0.003g
N/A
Omega-6 - Gamma-linoleic acid
0.002g
N/A
Omega-6 - Dihomo-gamma-linoleic acid
0.005g
N/A
Omega-6 - Eicosadienoic acid
0.003g
N/A
Omega-6 - Linoleic acid
0.825g
N/A
Macronutrient Comparison
Macronutrient breakdown side-by-side comparison
4
14%
29%
45%
9%
3%
Protein:
13.8 g
Fats:
29.4 g
Carbs:
44.9 g
Water:
9.2 g
Other:
2.7 g
1
5%
5%
37%
51%
Protein:
5.48 g
Fats:
5.38 g
Carbs:
37.14 g
Water:
50.8 g
Other:
1.2 g
Contains
more
Protein Protein
+151.8%
Contains
more
Fats Fats
+446.5%
Contains
more
Carbs Carbs
+20.9%
Contains
more
Other Other
+125%
Contains
more
Water Water
+452.2%
Fat Type Comparison
Fat type breakdown side-by-side comparison
2
20%
45%
35%
Saturated fat:
Sat. Fat
5.55 g
Monounsaturated fat:
Mono. Fat
12.53 g
Polyunsaturated fat:
Poly. Fat
9.65 g
1
54%
28%
18%
Saturated fat:
Sat. Fat
2.902 g
Monounsaturated fat:
Mono. Fat
1.514 g
Polyunsaturated fat:
Poly. Fat
0.989 g
Contains
more
Mono. Fat Monounsaturated fat
+727.6%
Contains
more
Poly. Fat Polyunsaturated fat
+875.7%
Contains
less
Sat. Fat Saturated fat
-47.7%