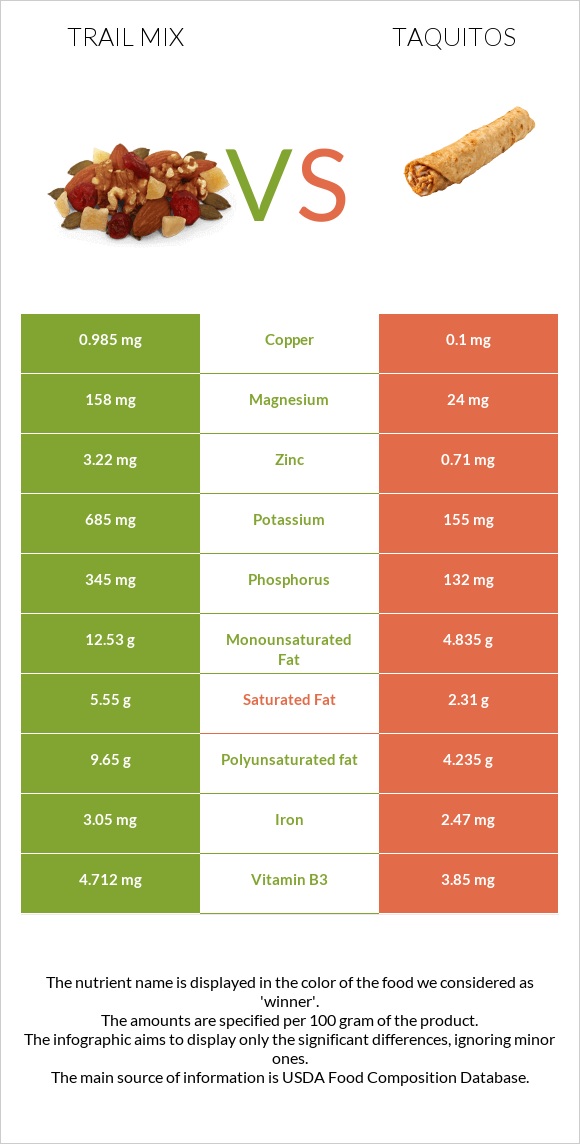
A recap on the differences between trail mix and taquitos Trail mix is higher than taquitos in copper, magnesium, phosphorus, manganese, zinc, potassium, vitamin B6, and vitamin B1. Trail mix covers your daily copper needs 98% more than taquitos. Trail mix contains 7 times more magnesium than taquitos. While trail mix contains 158mg of magnesium, taquitos contain only 24mg. The amount of saturated fat in taquitos is lower. The glycemic index of trail mix is lower. Food varieties used in this article are Snacks, trail mix, regular and Taquitos, frozen, chicken, and cheese, oven-heated .
Infographic
Mineral Comparison
Mineral comparison score is based on the number of minerals by which one or the other food is richer. The "coverage" charts below show how much of the daily needs can be covered by 300 grams of the food.
8
100 g
300 g
1 oz - 28.35g 1.5 oz - 42g 1 cup - 150g
Magnesium
Magnesium
Calcium
Calcium
Potassium
Potassium
Iron
Iron
Copper
Copper
Zinc
Zinc
Phosphorus
Phosphorus
Sodium
Sodium
Manganese
Manganese
Selenium
Selenium
113%
23%
60%
114%
328%
88%
148%
30%
135%
0%
2
100 g
300 g
1 piece - 42g
Magnesium
Magnesium
Calcium
Calcium
Potassium
Potassium
Iron
Iron
Copper
Copper
Zinc
Zinc
Phosphorus
Phosphorus
Sodium
Sodium
Manganese
Manganese
Selenium
Selenium
17%
31%
14%
93%
33%
19%
57%
59%
50%
91%
Vitamin Comparison
Vitamin comparison score is based on the number of vitamins by which one or the other food is richer. The "coverage" charts below show how much of the daily needs can be covered by 300 grams of the food.
5
100 g
300 g
1 oz - 28.35g 1.5 oz - 42g 1 cup - 150g
Vitamin C
Vit. C
Vitamin D
Vit. D
Vitamin A
Vit. A
Vitamin E
Vit. E
Vitamin B1
Vit. B1
Vitamin B2
Vit. B2
Vitamin B3
Vit. B3
Vitamin B5
Vit. B5
Vitamin B6
Vit. B6
Vitamin B12
Vit. B12
Vitamin K
Vit. K
Folate
Folate
4.7%
0%
0.33%
0%
116%
46%
88%
54%
69%
0%
0%
53%
6
100 g
300 g
1 piece - 42g
Vitamin C
Vit. C
Vitamin D
Vit. D
Vitamin A
Vit. A
Vitamin E
Vit. E
Vitamin B1
Vit. B1
Vitamin B2
Vit. B2
Vitamin B3
Vit. B3
Vitamin B5
Vit. B5
Vitamin B6
Vit. B6
Vitamin B12
Vit. B12
Vitamin K
Vit. K
Folate
Folate
0%
1.5%
10%
23%
83%
64%
72%
29%
32%
23%
42%
51%
All nutrients comparison - raw data values
Nutrient
DV% diff.
Copper
0.985mg
0.1mg
98%
Polyunsaturated fat
9.65g
4.235g
36%
Magnesium
158mg
24mg
32%
Phosphorus
345mg
132mg
30%
Selenium
16.7µg
30%
Manganese
1.034mg
0.387mg
28%
Fats
29.4g
12.54g
26%
Zinc
3.22mg
0.71mg
23%
Monounsaturated fat
12.53g
4.835g
19%
Potassium
685mg
155mg
16%
Saturated fat
5.55g
2.31g
15%
Vitamin K
16.9µg
14%
Fiber
2.9g
12%
Starch
29.62g
12%
Vitamin B6
0.298mg
0.14mg
12%
Vitamin B1
0.462mg
0.331mg
11%
Sodium
229mg
453mg
10%
Calories
462kcal
284kcal
9%
Protein
13.8g
9.21g
9%
Vitamin E
1.13mg
8%
Vitamin B5
0.895mg
0.481mg
8%
Vitamin B12
0µg
0.18µg
8%
Iron
3.05mg
2.47mg
7%
Vitamin B2
0.198mg
0.277mg
6%
Vitamin B3
4.712mg
3.85mg
5%
Carbs
44.9g
33.63g
4%
Cholesterol
0mg
13mg
4%
Calcium
78mg
104mg
3%
Vitamin A
1µg
30µg
3%
Choline
15.9mg
3%
Vitamin C
1.4mg
0mg
2%
Vitamin D
0.1µg
1%
Folate
71µg
68µg
1%
Protein per 100 calories
3g
3.2g
N/A
Calories per 10 g protein
335kcal
308kcal
N/A
Weight per 100 calories
22g
35g
N/A
Unsaturated / Saturated Fat ratio
4
3.9
N/A
Net carbs
44.9g
30.73g
N/A
Vitamin D*
3 IU
0%
Sugar
1.3g
N/A
Trans fat
0.071g
N/A
Tryptophan
0.166mg
0.1mg
0%
Threonine
0.482mg
0.269mg
0%
Isoleucine
0.515mg
0.358mg
0%
Leucine
0.89mg
0.717mg
0%
Lysine
0.515mg
0.468mg
0%
Methionine
0.202mg
0.189mg
0%
Phenylalanine
0.658mg
0.418mg
0%
Valine
0.658mg
0.428mg
0%
Histidine
0.357mg
0.249mg
0%
Fructose
0.12g
0%
Omega-3 - ALA
0.593g
N/A
Omega-6 - Dihomo-gamma-linoleic acid
0.003g
N/A
Omega-6 - Eicosadienoic acid
0.005g
N/A
Omega-6 - Linoleic acid
3.591g
N/A
Macronutrient Comparison
Macronutrient breakdown side-by-side comparison
4
14%
29%
45%
9%
3%
Protein:
13.8 g
Fats:
29.4 g
Carbs:
44.9 g
Water:
9.2 g
Other:
2.7 g
1
9%
13%
34%
43%
2%
Protein:
9.21 g
Fats:
12.54 g
Carbs:
33.63 g
Water:
42.74 g
Other:
1.88 g
Contains
more
Protein Protein
+49.8%
Contains
more
Fats Fats
+134.4%
Contains
more
Carbs Carbs
+33.5%
Contains
more
Other Other
+43.6%
Contains
more
Water Water
+364.6%
Fat Type Comparison
Fat type breakdown side-by-side comparison
2
20%
45%
35%
Saturated fat:
Sat. Fat
5.55 g
Monounsaturated fat:
Mono. Fat
12.53 g
Polyunsaturated fat:
Poly. Fat
9.65 g
1
20%
42%
37%
Saturated fat:
Sat. Fat
2.31 g
Monounsaturated fat:
Mono. Fat
4.835 g
Polyunsaturated fat:
Poly. Fat
4.235 g
Contains
more
Mono. Fat Monounsaturated fat
+159.2%
Contains
more
Poly. Fat Polyunsaturated fat
+127.9%
Contains
less
Sat. Fat Saturated fat
-58.4%