Turkey vs Lamb - Nutrition comparison and Health impact


Summary
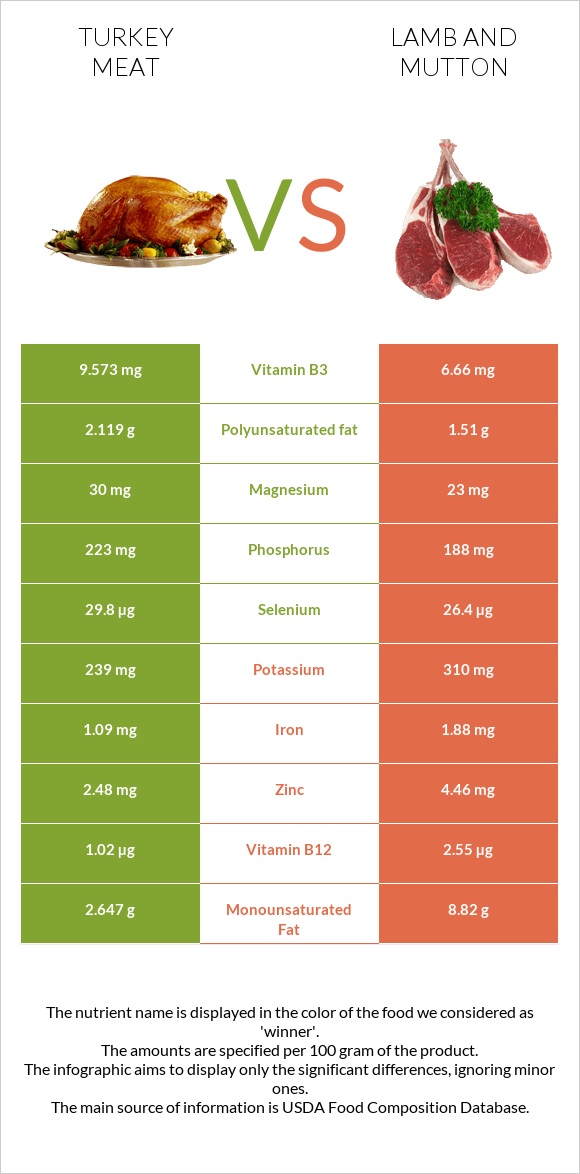
Lamb contains 100 more calories, three times higher in fats, and four times higher in saturated fats than turkey meat. Lamb is also richer in zinc, phosphorus, calcium, potassium, folate, and vitamin B12. Lamb is also lower in sodium.
On the other hand, turkey meat is richer in protein, selenium, phosphorus, vitamin A, vitamin D, and vitamin B3.
Introduction
This article compares two types of meat, turkey meat, and lamb. We will compare these two foods' nutritional content and health impacts.
The nutritional section will comprise the macros, minerals, and vitamins. In addition, the health section will focus on different health impacts provided by each food rather than common points.
Nutrition
This section will compare cooked and roasted turkey meat with skin and cooked lamb.
Calories
Lamb is higher in calories compared to turkey meat. Lamb contains 294 calories per 100g compared to turkey meat which has 189 calories.
Lamb has 64% more calories compared to turkey meat.
Carbs
Their carb content is negligible.
Fats
Turkey meat is leaner meat and contains fewer fats. Lamb has a three times higher fat content compared to turkey meat. Lamb meat contains nearly 21g of fat, whereas turkey meat contains 7.4g of fat.
Saturated Fat
Lamb meat is higher in saturated fats. It contains nearly four times more saturated fats compared to turkey meat. Turkey meat contains 2.1g of saturated fats, whereas lamb contains 8.8g of saturated fats.
Fat Type Comparison
Contains
less
Sat. FatSaturated fat
-75.6%
Contains
more
Poly. FatPolyunsaturated fat
+40.3%
Contains
more
Mono. FatMonounsaturated fat
+233.2%
Protein
Turkey meat is leaner meat.
It is richer in protein compared to lamb. Turkey meat contains 28.5g of protein compared to lamb, which contains 24.5g of protein.
Vitamins
Turkey meat is richer in vitamin D, vitamin A, vitamin B3, and vitamin E.
In comparison, lamb is richer in folate and B12.
In the diagram below, we can visualize their distribution.
Vitamin Comparison
Contains
more
Vitamin DVitamin D
+300%
Contains
more
Vitamin AVitamin A
+∞%
Contains
more
Vitamin B2Vitamin B2
+12.4%
Contains
more
Vitamin B3Vitamin B3
+43.7%
Contains
more
Vitamin B5Vitamin B5
+43.6%
Contains
more
Vitamin B6Vitamin B6
+373.8%
Contains
more
Vitamin EVitamin E
+100%
Contains
more
Vitamin B1Vitamin B1
+122.2%
Contains
more
Vitamin B12Vitamin B12
+150%
Contains
more
Vitamin KVitamin K
+∞%
Contains
more
FolateFolate
+100%
Minerals
Turkey meat is richer in magnesium, selenium, and phosphorus.
Lamb is richer in calcium, zinc, iron, and potassium. It is also lower in sodium than turkey meat.
In the diagram below, we can visualize their distribution.
Mineral Comparison
Contains
more
MagnesiumMagnesium
+30.4%
Contains
more
PhosphorusPhosphorus
+18.6%
Contains
more
SeleniumSelenium
+12.9%
Contains
more
CalciumCalcium
+21.4%
Contains
more
PotassiumPotassium
+29.7%
Contains
more
IronIron
+72.5%
Contains
more
CopperCopper
+28%
Contains
more
ZincZinc
+79.8%
Contains
less
SodiumSodium
-30.1%
Contains
more
ManganeseManganese
+57.1%
Glycemic Index
The glycemic indexes of lamb and turkey meat are equal to 0.
Health Impacts
This section will focus on each food's differences rather than common health impacts.
Turkey meat is richer in selenium which has antioxidative and positive immune properties (1).
Lamb is richer in vitamin B12 and iron, decreasing the risks of pernicious anemia and iron deficiency anemia (2) (3).
In addition to vitamin B12, lamb is richer in copper and zinc, which are necessary for several metabolic reactions. Zinc is important in male fertility regulation. In addition, copper is necessary for blood clotting and blood pressure regulation (4)(5).
Cardiovascular Health
Lamb generally has a higher saturated fat content compared to turkey, especially if you're consuming fattier cuts like lamb chops or ribs. A high intake of saturated fats is linked to an increased risk of cardiovascular disease (CVD) as it can elevate LDL (“bad” cholesterol) levels (6).
Both turkey and lamb contain cholesterol, but turkey may have a higher cholesterol content depending on the cut and preparation method. Opting for lean cuts of both turkey and lamb can help address some of these concerns. For instance, turkey breast is very low in saturated fat and cholesterol.
The method of preparation also matters. Healthier cooking methods such as grilling, baking, or broiling are preferable to frying or sautéing in unhealthy fats.
Regardless of the type of meat, portion control is crucial. Consuming large portions of any meat, including lean meats like turkey, can contribute to weight gain, which is a risk factor for CVD.
In conclusion, turkey and lamb can be part of a heart-healthy diet when consumed in moderation and lean cuts. However, for individuals concerned about CVD or looking to reduce their saturated fat intake, turkey may be the preferable option (7).
Diabetes
Based on an extensive study (8), substituting red meat consumption, particularly processed red meat, with alternative protein sources like turkey or chicken meat is linked to a reduced risk of developing type 2 diabetes mellitus. The research involved monitoring 27,634 males and 46,023 females and calculating Hazard Ratios (HRs) and 95% Confidence Intervals (CIs) to assess the association between replacing one daily serving of red meat with other protein options and the risk of type 2 diabetes mellitus.
References
- https://www.ncbi.nlm.nih.gov/books/NBK557551/
- https://www.ncbi.nlm.nih.gov/books/NBK540989/
- https://pubmed.ncbi.nlm.nih.gov/28189173/
- https://www.ncbi.nlm.nih.gov/pmc/articles/PMC3226389/
- https://www.ncbi.nlm.nih.gov/pmc/articles/PMC2820120/
- https://pubmed.ncbi.nlm.nih.gov/34649831/
- https://www.ncbi.nlm.nih.gov/pmc/articles/PMC10459134/
- https://www.ncbi.nlm.nih.gov/pmc/articles/PMC7948828/

Infographic
All nutrients comparison - raw data values
| Nutrient | |
|
DV% diff. |
| Vitamin B12 | 1.02µg | 2.55µg | 64% |
| Vitamin B6 | 0.616mg | 0.13mg | 37% |
| Saturated fat | 2.155g | 8.83g | 30% |
| Fats | 7.39g | 20.94g | 21% |
| Zinc | 2.48mg | 4.46mg | 18% |
| Vitamin B3 | 9.573mg | 6.66mg | 18% |
| Monounsaturated fat | 2.647g | 8.82g | 15% |
| Iron | 1.09mg | 1.88mg | 10% |
| Protein | 28.55g | 24.52g | 8% |
| Selenium | 29.8µg | 26.4µg | 6% |
| Vitamin B5 | 0.948mg | 0.66mg | 6% |
| Calories | 189kcal | 294kcal | 5% |
| Phosphorus | 223mg | 188mg | 5% |
| Vitamin B1 | 0.045mg | 0.1mg | 5% |
| Cholesterol | 109mg | 97mg | 4% |
| Vitamin K | 0µg | 4.6µg | 4% |
| Polyunsaturated fat | 2.119g | 1.51g | 4% |
| Copper | 0.093mg | 0.119mg | 3% |
| Vitamin D* | 15 IU | 2 IU | 2% |
| Vitamin D | 0.4µg | 0.1µg | 2% |
| Magnesium | 30mg | 23mg | 2% |
| Potassium | 239mg | 310mg | 2% |
| Vitamin B2 | 0.281mg | 0.25mg | 2% |
| Folate | 9µg | 18µg | 2% |
| Sodium | 103mg | 72mg | 1% |
| Vitamin A | 12µg | 0µg | 1% |
| Choline | 87.4mg | 93.7mg | 1% |
| Protein per 100 calories | 15g | 8.3g | N/A |
| Calories per 10 g protein | 66kcal | 120kcal | N/A |
| Weight per 100 calories | 53g | 34g | N/A |
| Unsaturated / Saturated Fat ratio | 2.2 | 1.2 | N/A |
| Net carbs | 0.06g | 0g | N/A |
| Carbs | 0.06g | 0g | 0% |
| Calcium | 14mg | 17mg | 0% |
| Vitamin E | 0.07mg | 0.14mg | 0% |
| Manganese | 0.014mg | 0.022mg | 0% |
| Trans fat | 0.101g | N/A | |
| Tryptophan | 0.291mg | 0.287mg | 0% |
| Threonine | 1.004mg | 1.05mg | 0% |
| Isoleucine | 0.796mg | 1.183mg | 0% |
| Leucine | 1.925mg | 1.908mg | 0% |
| Lysine | 2.282mg | 2.166mg | 0% |
| Methionine | 0.724mg | 0.629mg | 0% |
| Phenylalanine | 0.903mg | 0.998mg | 0% |
| Valine | 0.902mg | 1.323mg | 0% |
| Histidine | 0.749mg | 0.777mg | 0% |
| Omega-3 - EPA | 0.008g | 0g | N/A |
| Omega-3 - DHA | 0.005g | 0g | N/A |
| Omega-3 - ALA | 0.105g | N/A | |
| Omega-3 - DPA | 0.008g | 0g | N/A |
| Omega-3 - Eicosatrienoic acid | 0.001g | N/A | |
| Omega-6 - Gamma-linoleic acid | 0.003g | N/A | |
| Omega-6 - Dihomo-gamma-linoleic acid | 0.01g | N/A | |
| Omega-6 - Eicosadienoic acid | 0.014g | N/A | |
| Omega-6 - Linoleic acid | 1.841g | N/A |
Macronutrient Comparison
| Contains more ProteinProtein | +16.4% |
| Contains more CarbsCarbs | +∞% |
| Contains more WaterWater | +18.2% |
| Contains more FatsFats | +183.4% |
| Contains more OtherOther | +70.8% |
People also compare


References
All the values for which the sources are not specified explicitly are taken from FDA’s Food Central. The exact link to the food presented on this page can be found below.
- Turkey meat - https://fdc.nal.usda.gov/fdc-app.html#/food-details/171479/nutrients
- Lamb - https://fdc.nal.usda.gov/fdc-app.html#/food-details/172480/nutrients
All the Daily Values are presented for males aged 31-50, for 2000-calorie diets.