Turkey Meat Nutrition & Health – Complete Data of All Nutrients

Introduction
The meat of domesticated and wild turkeys is one of the most commonly consumed meat products in the average American household. For centuries, it has been a staple food during holidays, such as Thanksgiving and Christmas. But how much is actually known about turkey as food?
This article will discuss everything there is to know about turkey meat, from nutrition and health impact to history and production.
Classification
Turkey is the meat of a large bird of the Meleagris genus, native to North America. The two turkey species used for food today are the wild turkey or Meleagris gallopavo and the ocellated turkey or Meleagris ocellata. The wild turkey is from eastern and central North America, while the ocellated turkey exists in the Yucatán Peninsula in Mexico.
Turkey meat is classified as poultry and is, therefore, white meat. Compared to red meat, white meat contains less myoglobin and iron and is naturally lighter in color. This is because poultry, such as turkeys and chickens, have no developed muscles as they don’t use their wings to fly but only roam on the ground. For this reason, the breast and wing meat of the turkey is lighter in color compared to the leg meat, which is considered dark meat.
The meat of domesticated turkeys also tends to be lighter, as wild turkeys can learn to fly short distances.
Name
The name “turkey” has an interesting and somewhat amusing history. There are a few theories about how a bird native to North America acquired the name of a country half the world away.
Mario Pei, a Columbia University professor of Romance languages, had two theories to explain this name (1).
First, in the 15th century, when the bird first arrived in Great Britain, it was brought by Turkish merchants, who brought it over from America. The British started calling this new bird turkey-cock.
The second theory has to do with Turkish merchants as well. Before the global use of American turkey, the choice of poultry for the British was the Guinea fowl, also imported by the Turkish merchants. For the same reasons, this African bird was called turkey-cock at the time. When the British first saw the American turkey, similar to the Guinea turkey but only bigger, they decided to keep the name they already knew.
However, most of the world, including Turkey, does not call these birds “turkey.” Etymologist expert Mark Forsyth explains that as the Turkish knew this bird was not theirs, they called it “Hindi,” assuming it was from India. Similarly, the French initially called turkey “poulet d’Inde,” while the word in Russian is translated as “indyuk.”
The name “hindi” may also come from the fact that the Americas used to be referred to as “the Western Indies.”
Appearance and Taste
As poultry, turkey looks quite a lot like chicken. However, turkeys tend to be a little larger.
While the breast and wing meat is usually light pink, the leg meat can be darker. The color of wild turkey meat can also be darker than that of domesticated turkey meat.
Turkey also shares similarities with chicken when it comes to its taste. However, turkey is usually said to have a more intense, gamier flavor. One study even found that the taste of turkey is closer to pork than it is to chicken. Both turkey and pork were described as fatty, salty, sweet, and umami (2).
Wild turkey tends to have a gamier, more robust flavor than domesticated turkey.
You can visit this page if you’re interested in a complete comparison of turkey and chicken.
The younger the turkey is, the softer its meat and smoother skin.
Varieties
As stated before, the two species of turkey bird are wild turkey (Meleagris gallopavo) and ocellated turkey (Meleagris ocellata). The meat of both wild and ocellated turkeys can be used in the kitchen. In turn, both of these species can be domesticated or caught in the wild.
Turkey meat is often classified depending on its cut. The three main cuts of turkey are the breast, the wing, and the leg.
Turkey meat can be used as it is or used after processing. Unprocessed turkey meat is much more commonly consumed than processed turkey meat.
Based on the age and breastbone calcification of the animal, the USDA divides turkeys into four groups: fryer-roaster, young, yearling, and mature or old turkey, hen, or tom (3).
A fryer roaster is an immature turkey, usually under 16 weeks of age, of either sex, with tender meat, soft and smooth skin, and flexible breastbone cartilage.
A young turkey is usually under eight months of age, with characteristics similar to a fryer roaster, only with less flexible breastbone cartilage.
A yearling turkey is fully matured and usually under 15 months of age, with fairly tender meat and smooth skin.
Finally, a hen or a tom is an old turkey with tough meat and coarse skin, usually more than 15 months of age.
Nutrition
Naturally, the specifics of a turkey’s nutrition can change depending on its variety and cooking method, among other things.
Unless stated otherwise, the nutritional values below are presented for a whole roasted turkey with meat and skin.
Macronutrients and Calories
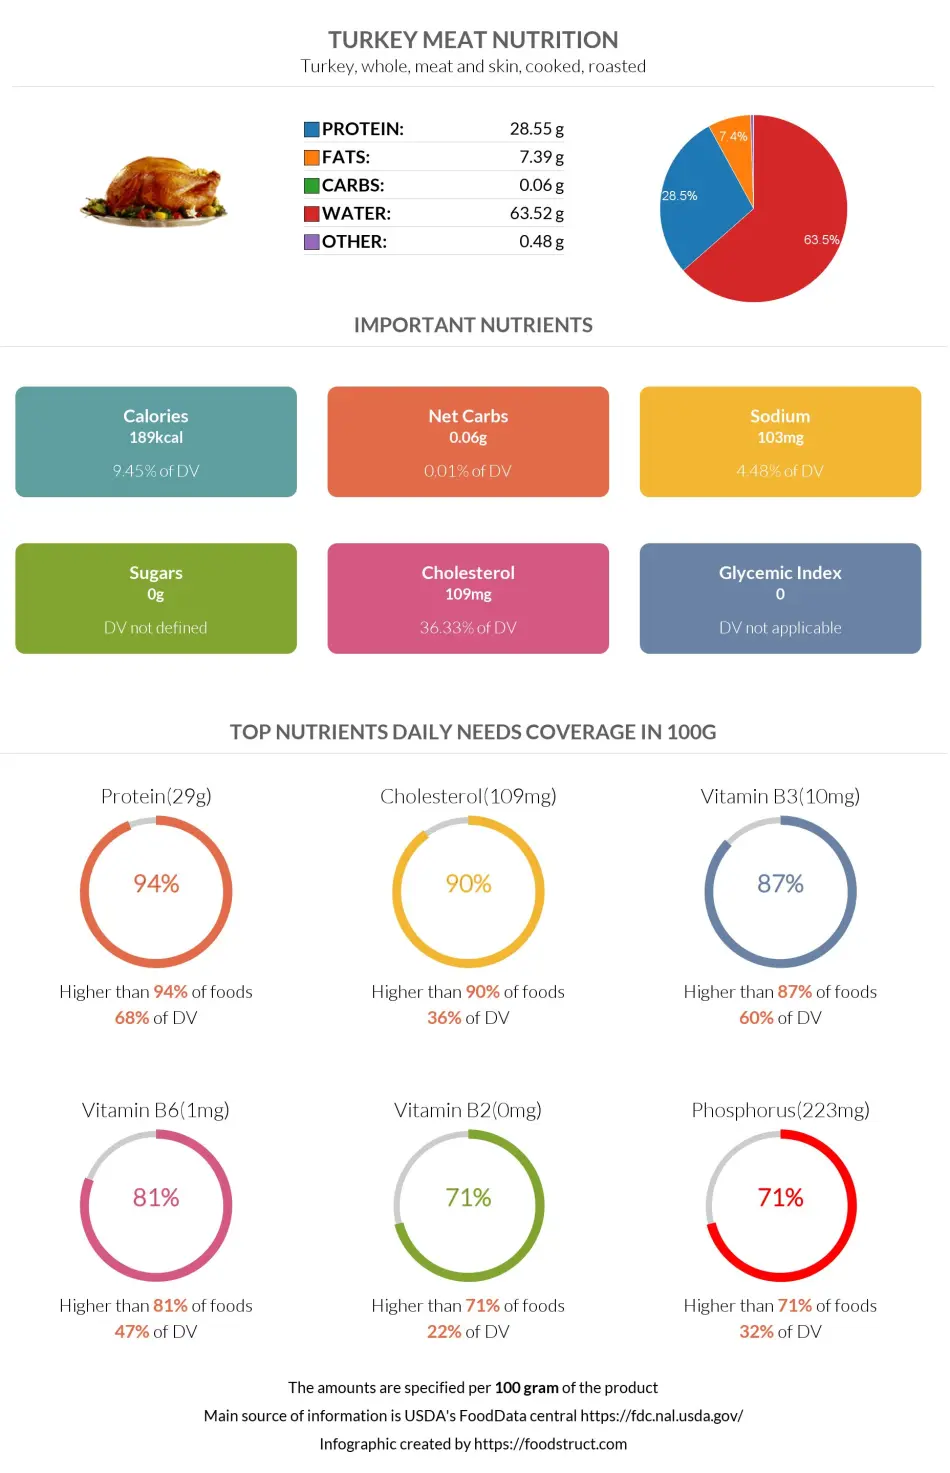
Turkey meat is relatively dense in nutrients. It consists of 63.5% water and 36.5% nutrients.
As stated by the FDA’s Reference Amounts Customarily Consumed, the average serving size of a turkey for one person is 3oz or 85 grams.
Macronutrients chart
Calories
A 100g serving size of turkey contains 189 calories, or one average serving size of turkey provides 161 calories. This means turkey is moderate to high in calories.
However, processed turkey tends to be higher in calories. For example, turkey sausages contain 196 calories in a 100g serving, while microwaved turkey bacon has 368 calories (4, 5).
Protein
Turkey is incredibly rich in proteins. It falls in the top 6% of foods as a source of protein.
In a 100g serving, turkey contains 28.5g of protein. Consuming this amount of turkey can provide 68% of the daily needed value for protein.
The protein found in turkey is of high quality, as it contains an adequate level of all essential amino acids. Turkey is exceptionally high in tryptophan, lysine, and histidine. A 100g serving of turkey provides the daily needed value for these amino acids.
However, turkey contains relatively lower isoleucine, valine, and phenylalanine levels.
Of the non-essential amino acids, turkey is rich in aspartic and glutamic acids while containing decent levels of glycine, proline, and serine.
Processed turkey meat tends to contain lower amounts of protein. The same serving size of turkey sausage contains 23.9g of protein (4).
Protein quality breakdown
Fats
Turkey meat is also rich in fats. Turkey contains 7.4 grams of fat in a 100g serving. This provides 11% of the daily needed fat content.
Of these fats, 2.16g is saturated, 2.65g is monounsaturated, and 2.12g is polyunsaturated. This means that the fatty acid content of turkey consists of 31% saturated fatty acids, 38% monounsaturated, and 31% polyunsaturated fats.
Turkey is particularly rich in saturated fats, a 100g serving also providing 11% of the daily needed value for saturated fats.
Turkey contains 0.1g of trans fats.
This meat is also very high in cholesterol, containing 109mg per 100g serving. This puts turkey meat in the top 10% of foods as a source of cholesterol.
Most of these fats are stored in the skin. A hundred-gram serving of roasted whole turkey meat without skin contains only 3.84g of fats (6).
However, processed forms of turkey are considerably higher in fats. A 100g of turkey sausage contains 10.4g of fat.
Fat type information
Carbohydrates
As with most meats, turkey contains an insignificant amount of carbohydrates. In a 100g serving of turkey, only 0.06g of total carbohydrates can be found. Turkey meat does not contain any amounts of dietary fiber.
Processed forms of turkey also usually contain no notable amounts of carbohydrates (4).
Vitamins
Turkey is an excellent source of most B complex vitamins. It falls in the top 13% of foods as a source of vitamin B3 and the top 19% as a source of vitamin B6.
A 200g serving of turkey alone can provide most of the daily value of vitamin B12 needed.
Turkey is also rich in vitamins B2, B5, D, and A. This meat contains some level of folate or vitamin B9, vitamin B1, and vitamin E.
Turkey, however, completely lacks vitamin C and vitamin K.
Vitamin coverage chart
Minerals
Turkey meat is abundant in most minerals. This meat falls in the top 35% of foods as a source of phosphorus, selenium, magnesium, and zinc.
Turkey is also rich in potassium, copper, iron, and choline while not being very high in calcium and manganese.
A 100g of turkey contains 103mg of sodium, which makes turkey fall in the top 48% of foods as a source of sodium.
Mineral coverage chart
Glycemic Index
Based on the deficient level of carbohydrates, the glycemic index of turkey meat is considered to be 0. If interested, you can learn more about the glycemic impact of foods with no carbohydrates.
Acidity
Turkey meat is slightly acidic. The pH value of turkey breast has been researched to fall in the range of 5.8 to 6. Very fresh turkey meat may have a pH value of 6.45; however, the acidity then quickly drops, staying at a pH value of around 6 (7).
The acidity of a turkey can also be measured by looking at its potential renal acid load or PRAL value. Turkey meat has a PRAL value of 16.3, making it an acid-producing food. The higher this positive number is, the more acid the food produces inside the body.
Weight Loss and Diets
Turkey is a moderate- or high-calorie food, containing 189 calories in a 100g serving. However, due to a shallow level of carbohydrates and a high protein level, turkey can still fit nicely in specific weight-loss diets.
For people watching their calorie and fat intake, the preferable choice would be skinless white breast or wing meat of the turkey, which is considerably leaner. A 100g of roasted breast meat contains 147 calories and only 2g of fat (8).
Research supports the idea that a low-calorie diet high in proteins leads to better weight loss results than a low-calorie diet low in proteins (9).
Consumption of poultry meat, including turkey, as part of a vegetable-rich diet, is associated with a risk reduction of developing overweight and obesity, cardiovascular diseases, and type 2 diabetes mellitus (10).
However, contrastingly, another study found that both poultry and processed meat consumption have a strong association with weight gain (11).
| Keto | Along with other meats, turkey fits perfectly in a keto diet, being high in protein and very low in carbohydrates. Unprocessed turkey meat is preferred over processed turkey for this diet. |
| DASH | Overall, poultry is the preferred choice of meat on a DASH diet instead of red meats. The DASH diet recommends cutting down on saturated fats, while turkey meat is high in these. This diet also encourages the consumption of less than one teaspoon or 2300mg of sodium a day. A 100g serving of turkey provides 103mg of sodium. Luckily, turkey is rich in protein, magnesium, and potassium. Overall, in moderation, unprocessed turkey can be consumed on a DASH diet. |
| Atkins | Due to the very low carbohydrate content, turkey, along with other poultry meats, fits into all phases of this diet. Turkey consumption can also help with sufficient protein intake, which the Atkins diet recommends. |
| Mediterranean | While turkey is a native American bird, the modern Mediterranean diet encourages the moderate consumption of poultry, including unprocessed turkey meat. |
| Paleo | Lean and unprocessed turkey meat fits perfectly into a paleo diet. |
| Vegan/ Vegetarian/ Pescetarian | Needless to say, turkey meat is not acceptable on vegan, vegetarian, or pescetarian diets. |
| Gluten-free | Turkey meat does not contain gluten. |
| Dukan | Turkey meat is on the list of acceptable foods for all four phases in the Dukan diet (12). |
| Intermittent Fasting | Like most foods, turkey can be eaten during the eating periods but not during the fasting periods. |
| Low Fat & Low Calorie | While turkey is not exceptionally low in fats or calories, it is lower in these than most other types of meat. A food is considered low-fat if it provides less than 3g of fats for every 100 calorie serving (13). Turkey contains 3.9g of fats per 100cal serving. The definition of a low-calorie food includes foods that contain less than 40 calories in one average serving size. One average serving size of turkey provides 160 calories. If chosen to consume turkey on low-fat and low-calorie diets, lean breast or wing meat, without the skin, is the better option. |
| Low Carb | Turkey, along with most meats, is perfect for a low-carb diet. |
| Anti Inflammatory | An anti-inflammatory diet recommends limiting saturated fats. While turkey is preferred over red meat on this diet, it is still not ideal. Fatty fish is the perfect choice of meat on an anti-inflammatory diet (14). |
| BRAT | Unseasoned and skinless turkey is acceptable to eat on a BRAT diet, starting from day two after the vomiting and diarrhea have stopped (15). |
Health Impact
Various studies have been carried out regarding the association between the consumption of poultry, such as turkey and chicken, and the impact on several diseases and physiological states. In this section, the outcomes of these studies will be presented.
Health Benefits
Cardiovascular Health
Meta-analysis research has concluded that white meat consumption has an inverse association with all-cause mortality and a neutral association with cardiovascular mortality and disease (16).
While red and processed meat consumption has been linked to increased ischemic heart disease risk, the same cannot be applied to poultry and turkey (17).
One observational study concluded that poultry intake has an inverse association with the risk of developing coronary artery disease (18).
Overall, studies find that turkey consumption has either a positive or a neutral effect on cardiovascular health. Most of these studies conclude that turkey has a preferable impact on cardiovascular health compared to red and processed meats.
Diabetes
Once again, unlike red meat, unprocessed poultry is not associated with an increased risk of type 2 diabetes mellitus (19). The mechanisms behind red meat’s negative impact on health probably relate to its heme-iron, saturated fat, sodium, and nitrate contents. Turkey is lower in all of these compounds.
For people at risk of type 2 diabetes, research suggests cooking meat at lower temperatures or a brief period of high heat, such as with slow cookers, baking, sous-vide, boiling, steaming, stewing, and stir-frying. High-heat and open-flame methods like grilling, barbecuing, broiling, and roasting have increased the risk of developing type 2 diabetes (20).
You can read this article to learn more about how turkey meat affects people with diabetes.
Cancer
Currently, the American Cancer Society does not have any recommendations against unprocessed turkey consumption (21).
A literature review confirms the inverse association between the number of weekly poultry servings and the risk of esophageal carcinoma (10).
Substitute red meat with white meat is recommended to decrease the risk of esophagus, liver, colon, rectum, anus, lung, pleura, and breast cancer (10, 22).
Mental Health
People often say that eating turkey can make them drowsy. There is some scientific truth to this.
Turkey is rich in the amino acid tryptophan, which is known to be involved in sleep and mood control, causing drowsiness. While eating turkey can not turn someone into a sleepier person, people can feel drowsy, especially in large amounts (23).
Tryptophan is also the only precursor of serotonin synthesis. As an essential determinant of mood, cognition, and behavior, tryptophan has also been researched to have the potential to be used in the treatment of psychiatric disorders, especially effective in combination with other therapeutic agents (24).
Some research suggests that those who abstain from meat consumption have a greater risk or prevalence of depression, anxiety, and self-harm (25).
Pregnancy
Poultry meat consumption contributes to the overall quality of the diet in specific ages and conditions, such as the period before conception, during pregnancy, and up to the end of breastfeeding. Maternal diet quality is among the factors affecting the health of both the mother and the infant (10).
Well-cooked lean meats, such as turkey and chicken, are recommended to be favored during pregnancy (10).
Poultry is also a great source of essential fatty acids and vitamins, the required dietary intakes of which increase during pregnancy (10).
The WHO (World Health Organisation) recommends that poultry be eaten daily or as often as possible for the complementary feeding of children (26).
However, due to the risk of contamination, deli turkey is advised to be strictly limited to pregnant women (27).
Downsides and Risks
Processed Turkey
Meat undergoes processing to extend its shelf life and improve its taste and color, along with other improvements. Some processing methods include curing, smoking, salting, drying, or adding preservatives and colorings.
Like other processed meats, processed turkey has been researched to have a significantly larger negative impact on health than non-processed turkey.
Research has indicated strong associations between processed meat consumption and cardiovascular disease and diabetes incidence (18, 19, 10).
There is suggestive evidence that processed meat can increase the risk of nasopharyngeal, esophageal, lung, stomach, and pancreatic cancer incidence (28).
Cardiovascular Health
Contrary to the previous studies, one research has found poultry to be significantly associated with a small increased risk of incident cardiovascular disease (29).
Cancer
While protective against some types of cancers, poultry has also been studied to increase the risk of others.
Poultry intake has been positively associated with the risk of malignant melanoma, prostate cancer, and non-Hodgkin lymphoma (30).
Cooking and Use
According to the USDA’s recommendations, all poultry, including turkey and chicken meat, must be cooked at a minimum internal temperature of 165ºF or 74ºC (31). When cooking poultry, the minimum oven temperature is 325ºF or 162.8ºC (32). Usually, a turkey is roasted at a temperature of 325ºF to 350ºF (162.8ºC to 176.6ºC).
Turkey can be sold whole, ground, or in cut pieces, including the breast, the wing, or the leg. Unsurprisingly, the most popular recipe for cooking turkey in North America is whole roasted turkey, used for festivities such as Thanksgiving and Christmas.
After Thanksgiving, cold cuts of the leftover roasted turkey are used in sandwiches.
Ground turkey can be used to make turkey burgers, marketed as a healthier alternative to beef burgers. Ground turkey is also used to make meatballs or meatloaf.
Turkey can also undergo processing to produce smoked turkey, turkey sausages, pastrami turkey, and other types of processed turkey meat.
Storage, Keeping, and Conservation
According to recommendations by the USDA, a fresh whole turkey, parts, and giblets may be stored in the refrigerator for one to two days before cooking. After cooking, turkey meat and dishes containing turkey are to be refrigerated for up to four days, at under 40ºF or 4.4ºC temperature, or frozen for more extended storage. For the best quality, a frozen raw turkey should be used within one year. All frozen turkey products are safe indefinitely (33).
Leftovers should never be left at room temperature for long. Harmful bacteria can start growing at around 40ºF to 140ºF (4.4ºC to 60ºC) without changing the turkey’s taste, smell, or appearance (34).
If the turkey is frozen, it takes approximately 24 hours for every 4 to 5 pounds of the whole turkey to thaw in the refrigerator. Once the turkey is thawed, it can be kept in the refrigerator for 1 to 2 additional days before cooking (35).
Historical Facts
Since ancient times, turkey has been consumed as food by the indigenous people of North and Central America.
The earliest records of domestic turkeys in Mexico have been discovered to exist between 300 BC and 1500 AD. These birds have been found in Mesoamerica, within which pre-Columbian societies, such as the Mayas and Aztecs, flourished (36).
A rapid worldwide spread of chicken consumption, centuries later, in the 1500s, has been said to be related to King Ferdinand of Spain’s order for every ship sailing from the Indies to Spain to bring ten turkeys - five male and five female (37).
Production and Consumption
The United States is the number one producer and consumer of turkey meat. The US produced 2.7 million metric tons of turkey meat in 2019, with a yearly production growth of 1% (38).
Surprisingly, Brazil is the second-largest producer of turkey meat. After producing 588 thousand metric tons of turkey in 2019, Brazil’s production has grown by 4.6% in the last 5 years (38).
Other large producers of turkey meat are Germany, France, Italy, Spain, Poland, Canada, the United Kingdom, and Israel.
According to 2014 data, the top countries in turkey meat consumption are as follows: the US, Brazil, Canada, Mexico, Russia, South Africa, and China (39).
Price
While fresh turkey may be more nutritious, frozen turkey is more accessible due to its lower price.
According to statistics, the price of turkeys has gone up since 1995 but has also gone down since 2013. In 1995, a pound of whole, frozen turkey had an average price of 0.99 US dollars. In 2013, the price of frozen turkey reached its peak of 1.65 US dollars per pound. The latest results show that in 2019, the average price of a pound of turkey was 1.39 US dollars (40).
Environmental Impact
The impact of the production of animal products on climate change has been gaining more attention over the last few years. Some concerns are greenhouse gas emissions, fossil energy, and water use from meat production.
Turkey has a greenhouse gas emission of 10.9kg of CO2 equivalents. This number for lamb, beef, and cheese is 39.2, 27, and 13.5, respectively (41). Turkey is more environmentally friendly than these three animal products when looking at their carbon footprints.
However, among other animal products, chicken and eggs have a lower carbon footprint of 6.9 and 4.8 (41).
References
- https://www.npr.org/templates/story/story.php?storyId=97541602
- https://www.researchgate.net/publication/221837180
- https://www.ams.usda.gov/sites/default/files/media/PoultryStandard.pdf
- https://fdc.nal.usda.gov/fdc-app.html#/food-details/173871/nutrients
- https://fdc.nal.usda.gov/fdc-app.html#/food-details/171639/nutrients
- https://fdc.nal.usda.gov/fdc-app.html#/food-details/171481/nutrients
- https://www.researchgate.net/publication/12835390
- https://fdc.nal.usda.gov/fdc-app.html#/food-details/171496/nutrients
- https://www.ncbi.nlm.nih.gov/pubmed/24557522/
- https://www.ncbi.nlm.nih.gov/pmc/articles/PMC4462824/
- https://pubmed.ncbi.nlm.nih.gov/20592131/
- https://www.dukandiet.com/low-carb-diet/food-list
- Low-Fat Foods
- https://www.health.harvard.edu/staying-healthy/foods-that-fight-inflammation
- https://www.oregonclinic.com/diets-BRAT
- https://www.mdpi.com/2072-6643/13/2/676/pdf
- https://www.ncbi.nlm.nih.gov/pmc/articles/PMC3483430/
- https://www.ncbi.nlm.nih.gov/pubmed/10584044/
- https://www.researchgate.net/publication/235376408
- How Meat Is Cooked May Affect Risk of Type 2 Diabetes
- http://pressroom.cancer.org/index.php?s=20296&item=29968
- https://www.ncbi.nlm.nih.gov/pmc/articles/PMC3208759/
- https://www.bmj.com/content/335/7633/1288
- https://www.ncbi.nlm.nih.gov/pmc/articles/PMC2908021/
- https://www.tandfonline.com/doi/full/10.1080/10408398.2020.1741505
- https://apps.who.int/iris/handle/10665/42739
- https://www.ncbi.nlm.nih.gov/pmc/articles/PMC2939108/
- https://www.wcrf.org/dietandcancer/meat-fish-and-dairy/
- https://jamanetwork.com/journals/jamainternalmedicine/fullarticle/2759737
- https://jech.bmj.com/content/73/Suppl_1/A15.1
- Cooking Meat? Check the New Recommended Temperatures
- What is a safe internal temperature for cooking turkey parts?
- https://ask.usda.gov/s/article/What-are-suggested-storage-times-for-turkey
- https://ask.usda.gov/s/article/How-long-can-you-keep-leftover-cooked-turkey
- How long can a thawed turkey remain in the refrigerator after thawing?
- Not just for Christmas: Study sheds new light on ancient human-turkey relationship
- How Turkey Went Global
- https://www.nationmaster.com/nmx/ranking/turkey-meat-production
- https://www.nationmaster.com/nmx/ranking/turkey-meat-consumption
- https://www.statista.com/statistics/236843/retail-price-of-turkey-in-the-united-states/
- Climate and Environmental Impacts

Top nutrition facts for Turkey meat
| Calories ⓘ Calories for selected serving | 189 kcal |
|
Glycemic index ⓘ
Source: Less than 0.1g of carbs.
Check out our Glycemic index chart page for the full list.
|
0 (low) |
| Glycemic load ⓘ Glycemic Load (GL) is a metric that measures both the quality (Glycemic Index) and quantity of carbohydrates in a specific serving of food to estimate its impact on blood sugar levels. It is calculated as: (GI × Carbs in grams) / 100. | 0 (low) |
| Net carbs ⓘ Net Carbs = Total Carbohydrates – Fiber – Sugar Alcohols | 0 g |
| Default serving size ⓘ Serving sizes are mostly taken from FDA's Reference Amounts Customarily Consumed (RACCs) | 3 oz (85 g) |
| Acidity (Based on PRAL) ⓘ PRAL (Potential renal acid load) is calculated using a formula. On the PRAL scale the higher the positive value, the more is the acidifying effect on the body. The lower the negative value, the higher the alkalinity of the food. 0 is neutral. | 16.3 (acidic) |
| Oxalates | 0 mg ⓘ https://www.hsph.harvard.edu/nutrition-questionnaire-service-center/nutrient-tables-download-page/ |
Turkey meat calories (kcal)
| Calories for different serving sizes of turkey meat | Calories | Weight |
|---|---|---|
| Calories in 100 grams | 189 | |
| Calories in 3 oz | 161 | 85 g |
| Calories in 1 bird | 7205 | 3812 g |
Extra Nutrition facts for Turkey meat
| Protein per 100 calories ⓘ Shows how many grams of protein you get from 100 calories of this food, calculated as (protein in g ÷ calories) × 100. | 15 g |
| Calories per 10 g protein ⓘ Shows how many calories you need to eat from this food to get 10 g of protein, calculated as (calories ÷ protein in g) × 10. | 66 kcal |
| Weight per 100 calories ⓘ Shows how many grams of this food equal 100 kcal—higher grams mean a larger portion for the same calories. | 53 g |
| Unsaturated / Saturated Fat ratio ⓘ (monounsaturated + polyunsaturated) / saturated, ≥2 broadly recommended by major guidelines for heart health | 2.2 |
Turkey meat Glycemic index (GI)
Mineral chart - relative view
Vitamin chart - relative view
All nutrients for Turkey meat per 100g
| Nutrient | Value | DV% | In TOP % of foods | Comparison |
| Vitamin A | 12µg | 1% | 32% | |
| Calories | 189kcal | 9% | 51% |
4 times more than Orange
|
| Protein per 100 calories | 15g | N/A | 12% | |
| Calories per 10 g protein | 66kcal | N/A | 84% | |
| Weight per 100 calories | 53g | N/A | 50% | |
| Protein | 29g | 68% | 6% |
10.1 times more than Broccoli
|
| Unsaturated / Saturated Fat ratio | 2.2 | N/A | 40% | |
| Fats | 7.4g | 11% | 42% |
4.5 times less than Cheese
|
| Vitamin C | 0mg | 0% | 100% |
N/A
|
| Carbs | 0.06g | 0% | 75% |
469.5 times less than Rice
|
| Net carbs | 0.06g | N/A | 75% |
902.8 times less than Chocolate
|
| Cholesterol | 109mg | 36% | 6% |
3.4 times less than Egg
|
| Vitamin D* | 15 IU | 2% | 12% |
5.8 times less than Egg
|
| Vitamin D | 0.4µg | 2% | 12% |
5.5 times less than Egg
|
| Magnesium | 30mg | 7% | 25% |
4.7 times less than Almonds
|
| Calcium | 14mg | 1% | 62% |
8.9 times less than Milk
|
| Potassium | 239mg | 7% | 46% |
1.6 times more than Cucumber
|
| Iron | 1.1mg | 14% | 56% |
2.4 times less than Beef broiled
|
| Sugar | 0g | N/A | 100% |
N/A
|
| Fiber | 0g | 0% | 100% |
N/A
|
| Copper | 0.09mg | 10% | 42% |
1.5 times less than Shiitake
|
| Zinc | 2.5mg | 23% | 27% |
2.5 times less than Beef broiled
|
| Phosphorus | 223mg | 32% | 23% |
1.2 times more than Chicken meat
|
| Sodium | 103mg | 4% | 48% |
4.8 times less than White bread
|
| Vitamin E | 0.07mg | 0% | 57% |
20.9 times less than Kiwi
|
| Manganese | 0.01mg | 1% | 59% | |
| Selenium | 30µg | 54% | 14% | |
| Vitamin B1 | 0.05mg | 4% | 68% |
5.9 times less than Pea raw
|
| Vitamin B2 | 0.28mg | 22% | 22% |
2.2 times more than Avocado
|
| Vitamin B3 | 9.6mg | 60% | 6% |
Equal to Turkey meat
|
| Vitamin B5 | 0.95mg | 19% | 12% |
1.2 times less than Sunflower seeds
|
| Vitamin B6 | 0.62mg | 47% | 10% |
5.2 times more than Oats
|
| Vitamin B12 | 1µg | 43% | 28% |
1.5 times more than Pork
|
| Vitamin K | 0µg | 0% | 100% |
N/A
|
| Folate | 9µg | 2% | 51% |
6.8 times less than Brussels sprouts
|
| Trans fat | 0.1g | N/A | 20% |
147.4 times less than Margarine
|
| Choline | 87mg | 16% | 9% | |
| Saturated fat | 2.2g | 11% | 42% |
2.7 times less than Beef broiled
|
| Monounsaturated fat | 2.6g | N/A | 40% |
3.7 times less than Avocado
|
| Polyunsaturated fat | 2.1g | N/A | 23% |
22.3 times less than Walnut
|
| Tryptophan | 0.29mg | 0% | 9% |
Equal to Chicken meat
|
| Threonine | 1mg | 0% | 15% |
1.4 times more than Beef broiled
|
| Isoleucine | 0.8mg | 0% | 26% |
1.1 times less than Salmon raw
|
| Leucine | 1.9mg | 0% | 14% |
1.3 times less than Tuna Bluefin
|
| Lysine | 2.3mg | 0% | 10% |
5 times more than Tofu
|
| Methionine | 0.72mg | 0% | 9% |
7.5 times more than Quinoa
|
| Phenylalanine | 0.9mg | 0% | 17% |
1.4 times more than Egg
|
| Valine | 0.9mg | 0% | 26% |
2.2 times less than Soybean raw
|
| Histidine | 0.75mg | 0% | 15% |
Equal to Turkey meat
|
| Caffeine | 0mg | 0% | 100% | |
| Omega-3 - EPA | 0.01g | N/A | 9% |
86.3 times less than Salmon
|
| Omega-3 - DHA | 0.01g | N/A | 11% |
292 times less than Salmon
|
| Omega-3 - ALA | 0.11g | N/A | 8% |
87 times less than Canola oil
|
| Omega-3 - DPA | 0.01g | N/A | 14% |
21.3 times less than Salmon
|
| Omega-3 - Eicosatrienoic acid | 0g | N/A | 5% | |
| Omega-6 - Gamma-linoleic acid | 0g | N/A | 8% | |
| Omega-6 - Dihomo-gamma-linoleic acid | 0.01g | N/A | 6% | |
| Omega-6 - Eicosadienoic acid | 0.01g | N/A | 6% | |
| Omega-6 - Linoleic acid | 1.8g | N/A | 6% |
6.7 times less than Almonds
|
Check out similar food or compare with current
NUTRITION FACTS LABEL
Serving Size ______________
Health checks
Turkey meat nutrition infographic
References
All the values for which the sources are not specified explicitly are taken from FDA’s Food Central. The exact link to the food presented on this page can be found below.