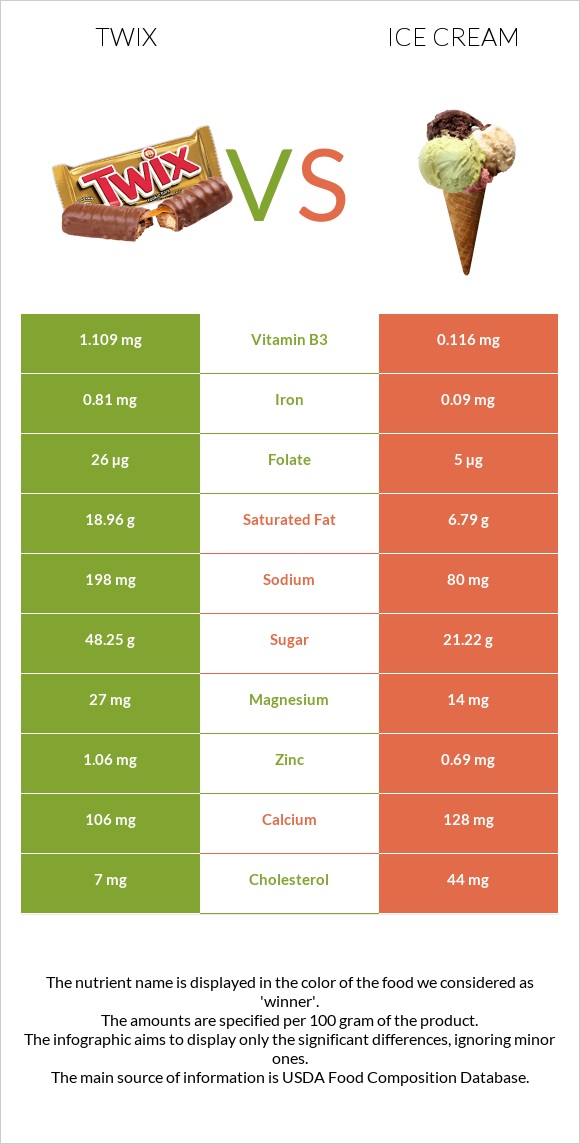
A recap on the differences between Twix and ice cream Twix has more copper, manganese, vitamin B1, iron, vitamin B3, and folate; however, ice cream is higher in vitamin A and vitamin B5. Twix covers your daily saturated fat needs 61% more than ice cream. Ice cream contains 34 times less manganese than Twix. Twix contains 0.273mg of manganese, while ice cream contains 0.008mg. Ice cream has less saturated fat. The glycemic index of ice cream is higher. Food varieties used in this article are Candies, MARS SNACKFOOD US, TWIX Caramel Cookie Bars and Ice creams, vanilla .
Infographic
Mineral Comparison
Mineral comparison score is based on the number of minerals by which one or the other food is richer. The "coverage" charts below show how much of the daily needs can be covered by 300 grams of the food.
6
100 g
300 g
1 package (2 oz) - 57g 1 package (2.06 oz, 2 bars) - 58g 1 package, king size (3.35 oz, 4 bars) - 95g 1 package (11 oz) - 312g
Magnesium
Magnesium
Calcium
Calcium
Potassium
Potassium
Iron
Iron
Copper
Copper
Zinc
Zinc
Phosphorus
Phosphorus
Sodium
Sodium
Manganese
Manganese
Selenium
Selenium
19%
32%
16%
30%
66%
29%
45%
26%
36%
23%
2
100 g
300 g
1 serving 1/2 cup - 66g
Magnesium
Magnesium
Calcium
Calcium
Potassium
Potassium
Iron
Iron
Copper
Copper
Zinc
Zinc
Phosphorus
Phosphorus
Sodium
Sodium
Manganese
Manganese
Selenium
Selenium
10%
38%
18%
3.4%
7.7%
19%
45%
10%
1%
9.8%
Vitamin Comparison
Vitamin comparison score is based on the number of vitamins by which one or the other food is richer. The "coverage" charts below show how much of the daily needs can be covered by 300 grams of the food.
5
100 g
300 g
1 package (2 oz) - 57g 1 package (2.06 oz, 2 bars) - 58g 1 package, king size (3.35 oz, 4 bars) - 95g 1 package (11 oz) - 312g
Vitamin C
Vit. C
Vitamin D
Vit. D
Vitamin A
Vit. A
Vitamin E
Vit. E
Vitamin B1
Vit. B1
Vitamin B2
Vit. B2
Vitamin B3
Vit. B3
Vitamin B5
Vit. B5
Vitamin B6
Vit. B6
Vitamin B12
Vit. B12
Vitamin K
Vit. K
Folate
Folate
2%
0%
6.7%
15%
39%
48%
21%
16%
5.8%
41%
14%
20%
6
100 g
300 g
1 serving 1/2 cup - 66g
Vitamin C
Vit. C
Vitamin D
Vit. D
Vitamin A
Vit. A
Vitamin E
Vit. E
Vitamin B1
Vit. B1
Vitamin B2
Vit. B2
Vitamin B3
Vit. B3
Vitamin B5
Vit. B5
Vitamin B6
Vit. B6
Vitamin B12
Vit. B12
Vitamin K
Vit. K
Folate
Folate
2%
3%
39%
6%
10%
55%
2.2%
35%
11%
49%
0.75%
3.8%
All nutrients comparison - raw data values
Nutrient
DV% diff.
Saturated fat
18.96g
6.79g
55%
Fats
24.85g
11g
21%
Copper
0.197mg
0.023mg
19%
Calories
502kcal
207kcal
15%
Carbs
64.8g
23.6g
14%
Cholesterol
7mg
44mg
12%
Manganese
0.273mg
0.008mg
12%
Vitamin A
20µg
118µg
11%
Vitamin B1
0.155mg
0.041mg
10%
Iron
0.81mg
0.09mg
9%
Vitamin B3
1.109mg
0.116mg
6%
Vitamin B5
0.265mg
0.581mg
6%
Sodium
198mg
80mg
5%
Selenium
4.3µg
1.8µg
5%
Folate
26µg
5µg
5%
Vitamin K
5.6µg
0.3µg
4%
Protein
4.91g
3.5g
3%
Magnesium
27mg
14mg
3%
Zinc
1.06mg
0.69mg
3%
Vitamin E
0.74mg
0.3mg
3%
Vitamin B12
0.33µg
0.39µg
3%
Calcium
106mg
128mg
2%
Fiber
1.1g
0.7g
2%
Vitamin B2
0.208mg
0.24mg
2%
Vitamin B6
0.025mg
0.048mg
2%
Caffeine
7mg
0mg
2%
Vitamin D*
0 IU
8 IU
1%
Vitamin D
0µg
0.2µg
1%
Choline
20.9mg
26mg
1%
Polyunsaturated fat
0.628g
0.452g
1%
Protein per 100 calories
0.98g
1.7g
N/A
Calories per 10 g protein
1022kcal
591kcal
N/A
Weight per 100 calories
20g
48g
N/A
Unsaturated / Saturated Fat ratio
0.19
0.5
N/A
Vitamin C
0.6mg
0.6mg
0%
Net carbs
63.7g
22.9g
N/A
Potassium
186mg
199mg
0%
Sugar
48.25g
21.22g
N/A
Phosphorus
105mg
105mg
0%
Trans fat
0.342g
N/A
Monounsaturated fat
2.988g
2.969g
0%
Tryptophan
0.045mg
0%
Threonine
0.146mg
0%
Isoleucine
0.195mg
0%
Leucine
0.316mg
0%
Lysine
0.258mg
0%
Methionine
0.081mg
0%
Phenylalanine
0.157mg
0%
Valine
0.217mg
0%
Histidine
0.088mg
0%
Omega-3 - EPA
0g
0.003g
N/A
Macronutrient Comparison
Macronutrient breakdown side-by-side comparison
4
5%
25%
65%
4%
Protein:
4.91 g
Fats:
24.85 g
Carbs:
64.8 g
Water:
4.23 g
Other:
1.21 g
1
4%
11%
24%
61%
Protein:
3.5 g
Fats:
11 g
Carbs:
23.6 g
Water:
61 g
Other:
0.9 g
Contains
more
Protein Protein
+40.3%
Contains
more
Fats Fats
+125.9%
Contains
more
Carbs Carbs
+174.6%
Contains
more
Other Other
+34.4%
Contains
more
Water Water
+1342.1%
Fat Type Comparison
Fat type breakdown side-by-side comparison
2
84%
13%
3%
Saturated fat:
Sat. Fat
18.96 g
Monounsaturated fat:
Mono. Fat
2.988 g
Polyunsaturated fat:
Poly. Fat
0.628 g
1
66%
29%
4%
Saturated fat:
Sat. Fat
6.79 g
Monounsaturated fat:
Mono. Fat
2.969 g
Polyunsaturated fat:
Poly. Fat
0.452 g
Contains
more
Poly. Fat Polyunsaturated fat
+38.9%
Contains
less
Sat. Fat Saturated fat
-64.2%
~equal in
Monounsaturated fat
~2.969g