Veggie burger vs. Cheese — In-Depth Nutrition Comparison
Compare
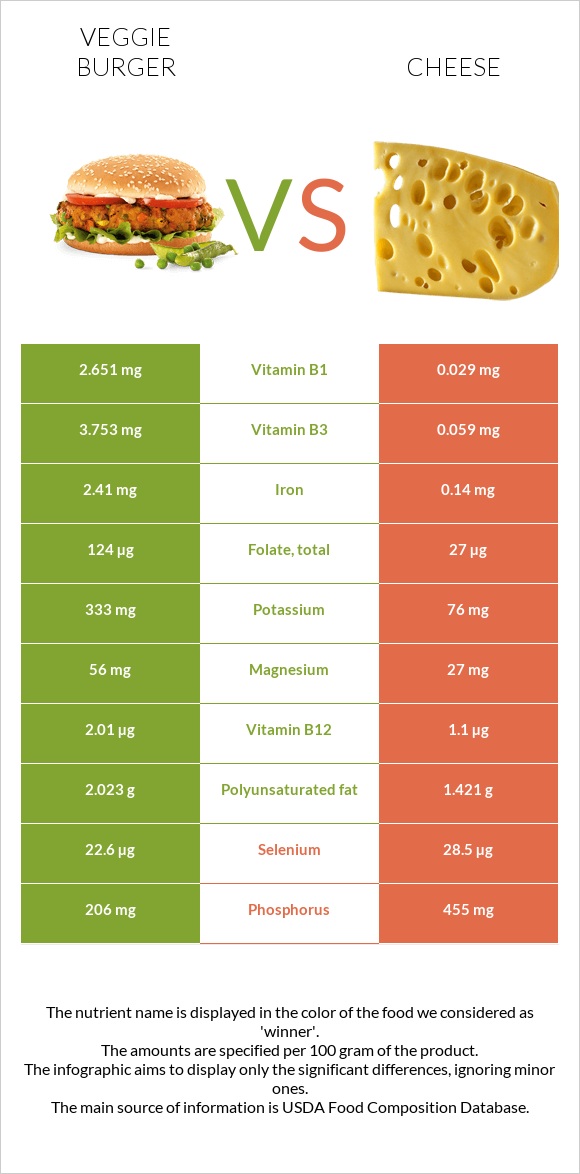
What are the main differences between veggie burgers and cheese?
- Veggie burgers are richer in vitamin B1, manganese, vitamin B12, iron, and folate, while cheese is higher in calcium, phosphorus, and vitamin A.
- Veggie burgers' daily need coverage for vitamin B1 is 219% higher.
- Cheese has 35 times less manganese than veggie burgers. Veggie burgers have 0.951mg of manganese, while cheese has 0.027mg.
- Veggie burgers are lower in saturated fat.
- Veggie burgers have a higher glycemic index (59) than cheese (0).
We used Veggie burgers or soyburgers, unprepared and Cheese, cheddar types in this comparison.
Infographic
Infographic link
Mineral Comparison
Mineral comparison score is based on the number of minerals by which one or the other food is richer. The "coverage" charts below show how much of the daily needs can be covered by 300 grams of the food.
| Contains more MagnesiumMagnesium | +107.4% |
| Contains more PotassiumPotassium | +338.2% |
| Contains more IronIron | +1621.4% |
| Contains more CopperCopper | +566.7% |
| Contains less SodiumSodium | -12.9% |
| Contains more ManganeseManganese | +3422.2% |
| Contains more CalciumCalcium | +422.1% |
| Contains more ZincZinc | +188.9% |
| Contains more PhosphorusPhosphorus | +120.9% |
| Contains more SeleniumSelenium | +26.1% |
Vitamin Comparison
Vitamin comparison score is based on the number of vitamins by which one or the other food is richer. The "coverage" charts below show how much of the daily needs can be covered by 300 grams of the food.
| Contains more Vitamin CVitamin C | +∞% |
| Contains more Vitamin B1Vitamin B1 | +9041.4% |
| Contains more Vitamin B3Vitamin B3 | +6261% |
| Contains more Vitamin B6Vitamin B6 | +359.1% |
| Contains more Vitamin B12Vitamin B12 | +82.7% |
| Contains more Vitamin KVitamin K | +75% |
| Contains more FolateFolate | +359.3% |
| Contains more Vitamin AVitamin A | +32900% |
| Contains more Vitamin EVitamin E | +208.7% |
| Contains more Vitamin DVitamin D | +∞% |
| Contains more Vitamin B2Vitamin B2 | +75.4% |
| Contains more Vitamin B5Vitamin B5 | +41.9% |
All nutrients comparison - raw data values
| Nutrient |  |
 |
DV% diff. |
| Vitamin B1 | 2.651mg | 0.029mg | 219% |
| Saturated fat | 1.44g | 18.867g | 79% |
| Calcium | 136mg | 710mg | 57% |
| Fats | 6.3g | 33.31g | 42% |
| Manganese | 0.951mg | 0.027mg | 40% |
| Vitamin B12 | 2.01µg | 1.1µg | 38% |
| Vitamin A | 1µg | 330µg | 37% |
| Phosphorus | 206mg | 455mg | 36% |
| Cholesterol | 5mg | 99mg | 31% |
| Iron | 2.41mg | 0.14mg | 28% |
| Folate | 124µg | 27µg | 24% |
| Vitamin B3 | 3.753mg | 0.059mg | 23% |
| Zinc | 1.26mg | 3.64mg | 22% |
| Fiber | 4.9g | 0g | 20% |
| Copper | 0.2mg | 0.03mg | 19% |
| Monounsaturated fat | 1.778g | 9.246g | 19% |
| Vitamin B6 | 0.303mg | 0.066mg | 18% |
| Protein | 15.7g | 22.87g | 14% |
| Vitamin B2 | 0.244mg | 0.428mg | 14% |
| Calories | 177kcal | 404kcal | 11% |
| Selenium | 22.6µg | 28.5µg | 11% |
| Potassium | 333mg | 76mg | 8% |
| Magnesium | 56mg | 27mg | 7% |
| Vitamin C | 4.5mg | 0mg | 5% |
| Carbs | 14.27g | 3.09g | 4% |
| Sodium | 569mg | 653mg | 4% |
| Polyunsaturated fat | 2.023g | 1.421g | 4% |
| Vitamin D | 0 IU | 24 IU | 3% |
| Vitamin E | 0.23mg | 0.71mg | 3% |
| Vitamin D | 0µg | 0.6µg | 3% |
| Starch | 5.78g | 2% | |
| Vitamin B5 | 0.289mg | 0.41mg | 2% |
| Vitamin K | 4.2µg | 2.4µg | 2% |
| Choline | 19.4mg | 16.5mg | 1% |
| Net carbs | 9.37g | 3.09g | N/A |
| Sugar | 1.07g | 0.48g | N/A |
| Trans fat | 0.917g | N/A | |
| Tryptophan | 0.162mg | 0.547mg | 0% |
| Threonine | 0.605mg | 1.044mg | 0% |
| Isoleucine | 0.78mg | 1.206mg | 0% |
| Leucine | 1.399mg | 1.939mg | 0% |
| Lysine | 1.004mg | 1.025mg | 0% |
| Methionine | 0.291mg | 0.547mg | 0% |
| Phenylalanine | 0.885mg | 1.074mg | 0% |
| Valine | 0.89mg | 1.404mg | 0% |
| Histidine | 0.465mg | 0.547mg | 0% |
| Fructose | 0.13g | 0g | 0% |
| Omega-3 - EPA | 0g | 0.01g | N/A |
| Omega-3 - DHA | 0g | 0.001g | N/A |
| Omega-3 - ALA | 0.081g | N/A | |
| Omega-3 - DPA | 0g | 0.017g | N/A |
| Omega-6 - Eicosadienoic acid | 0g | 0.007g | N/A |
Macronutrient Comparison
Macronutrient breakdown side-by-side comparison
Protein:
15.7 g
Fats:
6.3 g
Carbs:
14.27 g
Water:
61.21 g
Other:
2.52 g
Protein:
22.87 g
Fats:
33.31 g
Carbs:
3.09 g
Water:
37.02 g
Other:
3.71 g
| Contains more CarbsCarbs | +361.8% |
| Contains more WaterWater | +65.3% |
| Contains more ProteinProtein | +45.7% |
| Contains more FatsFats | +428.7% |
| Contains more OtherOther | +47.2% |
Fat Type Comparison
Fat type breakdown side-by-side comparison
Saturated fat:
Sat. Fat
1.44 g
Monounsaturated fat:
Mono. Fat
1.778 g
Polyunsaturated fat:
Poly. Fat
2.023 g
Saturated fat:
Sat. Fat
18.867 g
Monounsaturated fat:
Mono. Fat
9.246 g
Polyunsaturated fat:
Poly. Fat
1.421 g
| Contains less Sat. FatSaturated fat | -92.4% |
| Contains more Poly. FatPolyunsaturated fat | +42.4% |
| Contains more Mono. FatMonounsaturated fat | +420% |
Carbohydrate type comparison
Carbohydrate type breakdown side-by-side comparison
Starch:
5.78 g
Sucrose:
0.62 g
Glucose:
0.26 g
Fructose:
0.13 g
Lactose:
0.06 g
Maltose:
0 g
Galactose:
0 g
Starch:
0 g
Sucrose:
0 g
Glucose:
0.26 g
Fructose:
0 g
Lactose:
0.12 g
Maltose:
0 g
Galactose:
0.1 g
| Contains more StarchStarch | +∞% |
| Contains more SucroseSucrose | +∞% |
| Contains more FructoseFructose | +∞% |
| Contains more LactoseLactose | +100% |
| Contains more GalactoseGalactose | +∞% |
~equal in
Glucose
~0.26g
~equal in
Maltose
~0g


