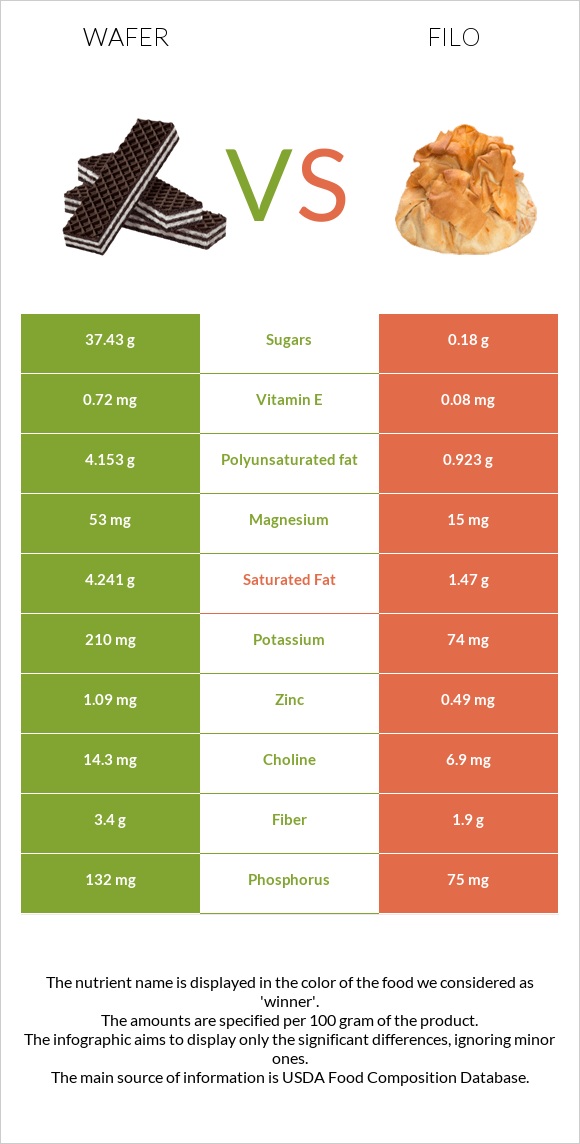
A recap on the differences between wafer and filo Wafer is higher in copper, iron, manganese, magnesium, and phosphorus, yet filo is higher in selenium, vitamin B1, folate, and vitamin B3. Wafer covers your daily copper needs 40% more than filo. Wafer contains 4 times more magnesium than filo. While wafer contains 53mg of magnesium, filo contains only 15mg. The amount of saturated fat in filo is lower. The glycemic index of filo is lower. Food varieties used in this article are Cookies, chocolate wafers and Phyllo dough .
Infographic
Mineral Comparison
Mineral comparison score is based on the number of minerals by which one or the other food is richer. The "coverage" charts below show how much of the daily needs can be covered by 300 grams of the food.
8
100 g
300 g
1 wafer - 6g 1 oz - 28.35g 1 cup, crumbs - 112g
Magnesium
Magnesium
Calcium
Calcium
Potassium
Potassium
Iron
Iron
Copper
Copper
Zinc
Zinc
Phosphorus
Phosphorus
Sodium
Sodium
Manganese
Manganese
Selenium
Selenium
38%
9.3%
19%
150%
154%
30%
57%
76%
91%
31%
2
100 g
300 g
1 sheet dough - 19g 1 oz - 28.35g
Magnesium
Magnesium
Calcium
Calcium
Potassium
Potassium
Iron
Iron
Copper
Copper
Zinc
Zinc
Phosphorus
Phosphorus
Sodium
Sodium
Manganese
Manganese
Selenium
Selenium
11%
3.3%
6.5%
120%
34%
13%
32%
63%
62%
127%
Vitamin Comparison
Vitamin comparison score is based on the number of vitamins by which one or the other food is richer. The "coverage" charts below show how much of the daily needs can be covered by 300 grams of the food.
5
100 g
300 g
1 wafer - 6g 1 oz - 28.35g 1 cup, crumbs - 112g
Vitamin C
Vit. C
Vitamin D
Vit. D
Vitamin A
Vit. A
Vitamin E
Vit. E
Vitamin B1
Vit. B1
Vitamin B2
Vit. B2
Vitamin B3
Vit. B3
Vitamin B5
Vit. B5
Vitamin B6
Vit. B6
Vitamin B12
Vit. B12
Vitamin K
Vit. K
Folate
Folate
0%
0%
1%
14%
51%
61%
54%
23%
12%
11%
6%
35%
4
100 g
300 g
1 sheet dough - 19g 1 oz - 28.35g
Vitamin C
Vit. C
Vitamin D
Vit. D
Vitamin A
Vit. A
Vitamin E
Vit. E
Vitamin B1
Vit. B1
Vitamin B2
Vit. B2
Vitamin B3
Vit. B3
Vitamin B5
Vit. B5
Vitamin B6
Vit. B6
Vitamin B12
Vit. B12
Vitamin K
Vit. K
Folate
Folate
0%
0%
0%
1.6%
135%
79%
76%
18%
6.9%
0%
6.3%
66%
All nutrients comparison - raw data values
Nutrient
DV% diff.
Copper
0.463mg
0.101mg
40%
Selenium
5.7µg
23.3µg
32%
Vitamin B1
0.203mg
0.541mg
28%
Polyunsaturated fat
4.153g
0.923g
22%
Fats
14.2g
6g
13%
Saturated fat
4.241g
1.47g
13%
Iron
4.01mg
3.21mg
10%
Manganese
0.696mg
0.476mg
10%
Folate
47µg
88µg
10%
Magnesium
53mg
15mg
9%
Phosphorus
132mg
75mg
8%
Vitamin B3
2.858mg
4.073mg
8%
Calories
433kcal
299kcal
7%
Carbs
72.7g
52.6g
7%
Fiber
3.4g
1.9g
6%
Vitamin B2
0.266mg
0.341mg
6%
Zinc
1.09mg
0.49mg
5%
Potassium
210mg
74mg
4%
Sodium
580mg
483mg
4%
Vitamin E
0.72mg
0.08mg
4%
Vitamin B12
0.09µg
0µg
4%
Monounsaturated fat
4.865g
3.149g
4%
Caffeine
10mg
0mg
3%
Calcium
31mg
11mg
2%
Vitamin B5
0.381mg
0.302mg
2%
Vitamin B6
0.051mg
0.03mg
2%
Protein
6.6g
7.1g
1%
Cholesterol
2mg
0mg
1%
Choline
14.3mg
6.9mg
1%
Protein per 100 calories
1.5g
2.4g
N/A
Calories per 10 g protein
656kcal
421kcal
N/A
Weight per 100 calories
23g
33g
N/A
Unsaturated / Saturated Fat ratio
2.1
2.8
N/A
Net carbs
69.3g
50.7g
N/A
Sugar
37.43g
0.18g
N/A
Vitamin A
3µg
0µg
0%
Vitamin K
2.4µg
2.5µg
0%
Tryptophan
0.096mg
0.088mg
0%
Threonine
0.22mg
0.194mg
0%
Isoleucine
0.261mg
0.246mg
0%
Leucine
0.447mg
0.49mg
0%
Lysine
0.281mg
0.158mg
0%
Methionine
0.105mg
0.126mg
0%
Phenylalanine
0.308mg
0.359mg
0%
Valine
0.323mg
0.286mg
0%
Histidine
0.128mg
0.159mg
0%
Omega-3 - EPA
0.003g
0g
N/A
Omega-3 - DHA
0.002g
0g
N/A
Macronutrient Comparison
Macronutrient breakdown side-by-side comparison
3
7%
14%
73%
5%
2%
Protein:
6.6 g
Fats:
14.2 g
Carbs:
72.7 g
Water:
4.5 g
Other:
2 g
2
7%
6%
53%
33%
2%
Protein:
7.1 g
Fats:
6 g
Carbs:
52.6 g
Water:
32.6 g
Other:
1.7 g
Contains
more
Fats Fats
+136.7%
Contains
more
Carbs Carbs
+38.2%
Contains
more
Other Other
+17.6%
Contains
more
Water Water
+624.4%
Fat Type Comparison
Fat type breakdown side-by-side comparison
2
32%
37%
31%
Saturated fat:
Sat. Fat
4.241 g
Monounsaturated fat:
Mono. Fat
4.865 g
Polyunsaturated fat:
Poly. Fat
4.153 g
1
27%
57%
17%
Saturated fat:
Sat. Fat
1.47 g
Monounsaturated fat:
Mono. Fat
3.149 g
Polyunsaturated fat:
Poly. Fat
0.923 g
Contains
more
Mono. Fat Monounsaturated fat
+54.5%
Contains
more
Poly. Fat Polyunsaturated fat
+349.9%
Contains
less
Sat. Fat Saturated fat
-65.3%