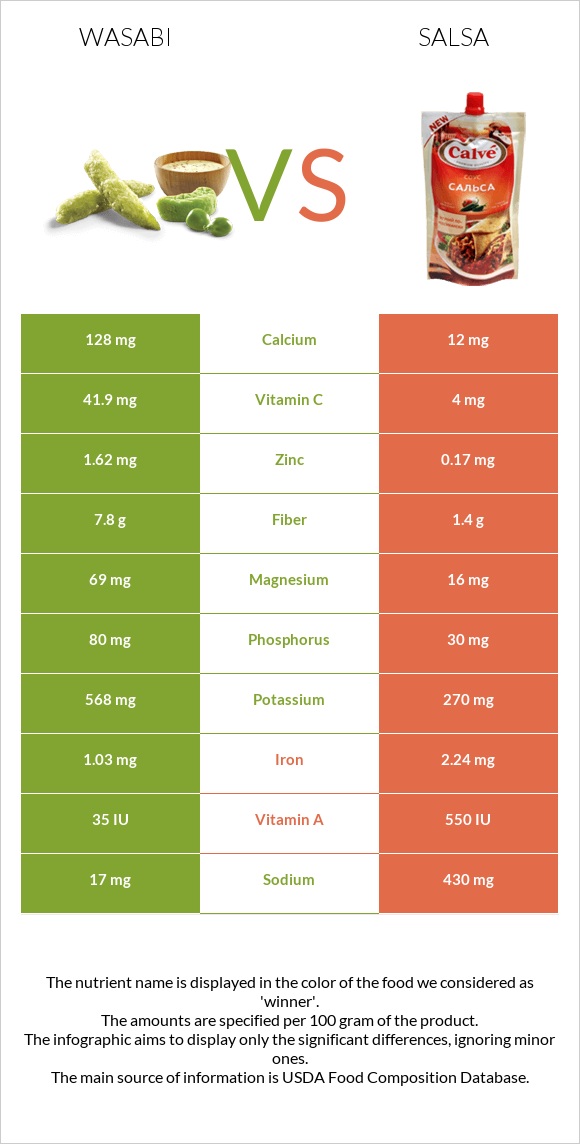
How are wasabi and salsa different? Wasabi is richer in vitamin C, fiber, zinc, magnesium, calcium, vitamin B6, and potassium, while salsa is higher in iron and vitamin A. Wasabi covers your daily need for vitamin C, 42% more than salsa. Wasabi contains 11 times more calcium than salsa. Wasabi contains 128mg of calcium, while salsa contains 12mg. Wasabi is lower in sodium. Wasabi, root, raw and USDA Commodity, salsa types were used in this article.
Infographic
Mineral Comparison
Mineral comparison score is based on the number of minerals by which one or the other food is richer. The "coverage" charts below show how much of the daily needs can be covered by 300 grams of the food.
8
100 g
300 g
1 cup, sliced - 130g 1 root - 169g
Magnesium
Magnesium
Calcium
Calcium
Potassium
Potassium
Iron
Iron
Copper
Copper
Zinc
Zinc
Phosphorus
Phosphorus
Sodium
Sodium
Manganese
Manganese
Selenium
Selenium
49%
38%
50%
39%
52%
44%
34%
2.2%
51%
0%
2
100 g
300 g
Magnesium
Magnesium
Calcium
Calcium
Potassium
Potassium
Iron
Iron
Copper
Copper
Zinc
Zinc
Phosphorus
Phosphorus
Sodium
Sodium
Manganese
Manganese
Selenium
Selenium
11%
3.6%
24%
84%
32%
4.6%
13%
56%
0%
2.2%
Vitamin Comparison
Vitamin comparison score is based on the number of vitamins by which one or the other food is richer. The "coverage" charts below show how much of the daily needs can be covered by 300 grams of the food.
5
100 g
300 g
1 cup, sliced - 130g 1 root - 169g
Vitamin C
Vit. C
Vitamin D
Vit. D
Vitamin A
Vit. A
Vitamin E
Vit. E
Vitamin B1
Vit. B1
Vitamin B2
Vit. B2
Vitamin B3
Vit. B3
Vitamin B5
Vit. B5
Vitamin B6
Vit. B6
Vitamin B12
Vit. B12
Vitamin K
Vit. K
Folate
Folate
140%
0%
0.67%
0%
33%
26%
14%
12%
63%
0%
0%
14%
2
100 g
300 g
Vitamin C
Vit. C
Vitamin D
Vit. D
Vitamin A
Vit. A
Vitamin E
Vit. E
Vitamin B1
Vit. B1
Vitamin B2
Vit. B2
Vitamin B3
Vit. B3
Vitamin B5
Vit. B5
Vitamin B6
Vit. B6
Vitamin B12
Vit. B12
Vitamin K
Vit. K
Folate
Folate
13%
0%
9.3%
0%
13%
6.9%
20%
0%
34%
0%
0%
14%
All nutrients comparison - raw data values
Nutrient
DV% diff.
Vitamin C
41.9mg
4mg
42%
Fiber
7.8g
1.4g
26%
Sodium
17mg
430mg
18%
Manganese
0.391mg
17%
Iron
1.03mg
2.24mg
15%
Magnesium
69mg
16mg
13%
Zinc
1.62mg
0.17mg
13%
Calcium
128mg
12mg
12%
Vitamin B6
0.274mg
0.149mg
10%
Potassium
568mg
270mg
9%
Protein
4.8g
1.5g
7%
Copper
0.155mg
0.096mg
7%
Phosphorus
80mg
30mg
7%
Vitamin B1
0.131mg
0.05mg
7%
Carbs
23.54g
7g
6%
Vitamin B2
0.114mg
0.03mg
6%
Calories
109kcal
36kcal
4%
Vitamin B5
0.203mg
4%
Vitamin A
2µg
28µg
3%
Vitamin B3
0.743mg
1.08mg
2%
Fats
0.63g
0.2g
1%
Selenium
0.4µg
1%
Polyunsaturated fat
0.107g
1%
Protein per 100 calories
4.4g
4.2g
N/A
Calories per 10 g protein
227kcal
240kcal
N/A
Weight per 100 calories
92g
278g
N/A
Net carbs
15.74g
5.6g
N/A
Folate
18µg
19µg
0%
Saturated fat
0.029g
0%
Monounsaturated fat
0.016g
0%
Macronutrient Comparison
Macronutrient breakdown side-by-side comparison
4
5%
24%
69%
2%
Protein:
4.8 g
Fats:
0.63 g
Carbs:
23.54 g
Water:
69.11 g
Other:
1.92 g
1
7%
90%
Protein:
1.5 g
Fats:
0.2 g
Carbs:
7 g
Water:
89.7 g
Other:
1.6 g
Contains
more
Protein Protein
+220%
Contains
more
Fats Fats
+215%
Contains
more
Carbs Carbs
+236.3%
Contains
more
Other Other
+20%
Contains
more
Water Water
+29.8%