Significant differences between flour and cheese Flour has more vitamin B1, iron, folate, vitamin B3, and manganese; however, cheese is richer in calcium, phosphorus, and vitamin B12. Cheese covers your daily saturated fat needs 94% more than flour. Cheese has 100 times less vitamin B3 than flour. Flour has 5.904mg of vitamin B3, while cheese has 0.059mg. Flour contains less saturated fat. Flour has a higher glycemic index. The glycemic index of flour is 72, while the glycemic index of cheese is 0. Specific food types used in this comparison are Wheat flour, white, all-purpose, enriched, bleached and Cheese, cheddar .
Infographic
Mineral Comparison
Mineral comparison score is based on the number of minerals by which one or the other food is richer. The "coverage" charts below show how much of the daily needs can be covered by 300 grams of the food.
6
100 g
300 g
1 cup - 125g
Magnesium
Magnesium
Calcium
Calcium
Potassium
Potassium
Iron
Iron
Copper
Copper
Zinc
Zinc
Phosphorus
Phosphorus
Sodium
Sodium
Manganese
Manganese
Selenium
Selenium
16%
4.5%
9.4%
174%
48%
19%
46%
0.26%
89%
185%
4
100 g
300 g
1 cubic inch - 17g 1 slice (1 oz) - 28g 1 oz - 28.35g 1 cup, shredded - 113g 1 cup, diced - 132g 1 cup, melted - 244g
Magnesium
Magnesium
Calcium
Calcium
Potassium
Potassium
Iron
Iron
Copper
Copper
Zinc
Zinc
Phosphorus
Phosphorus
Sodium
Sodium
Manganese
Manganese
Selenium
Selenium
19%
213%
6.7%
5.3%
10%
99%
195%
85%
3.5%
155%
Vitamin Comparison
Vitamin comparison score is based on the number of vitamins by which one or the other food is richer. The "coverage" charts below show how much of the daily needs can be covered by 300 grams of the food.
4
100 g
300 g
1 cup - 125g
Vitamin C
Vit. C
Vitamin D
Vit. D
Vitamin A
Vit. A
Vitamin E
Vit. E
Vitamin B1
Vit. B1
Vitamin B2
Vit. B2
Vitamin B3
Vit. B3
Vitamin B5
Vit. B5
Vitamin B6
Vit. B6
Vitamin B12
Vit. B12
Vitamin K
Vit. K
Folate
Folate
0%
0%
0%
1.2%
196%
114%
111%
26%
10%
0%
0.75%
137%
6
100 g
300 g
1 cubic inch - 17g 1 slice (1 oz) - 28g 1 oz - 28.35g 1 cup, shredded - 113g 1 cup, diced - 132g 1 cup, melted - 244g
Vitamin C
Vit. C
Vitamin D
Vit. D
Vitamin A
Vit. A
Vitamin E
Vit. E
Vitamin B1
Vit. B1
Vitamin B2
Vit. B2
Vitamin B3
Vit. B3
Vitamin B5
Vit. B5
Vitamin B6
Vit. B6
Vitamin B12
Vit. B12
Vitamin K
Vit. K
Folate
Folate
0%
9%
110%
14%
7.3%
99%
1.1%
25%
15%
138%
6%
20%
All nutrients comparison - raw data values
Nutrient
DV% diff.
Saturated fat
0.155g
18.867g
85%
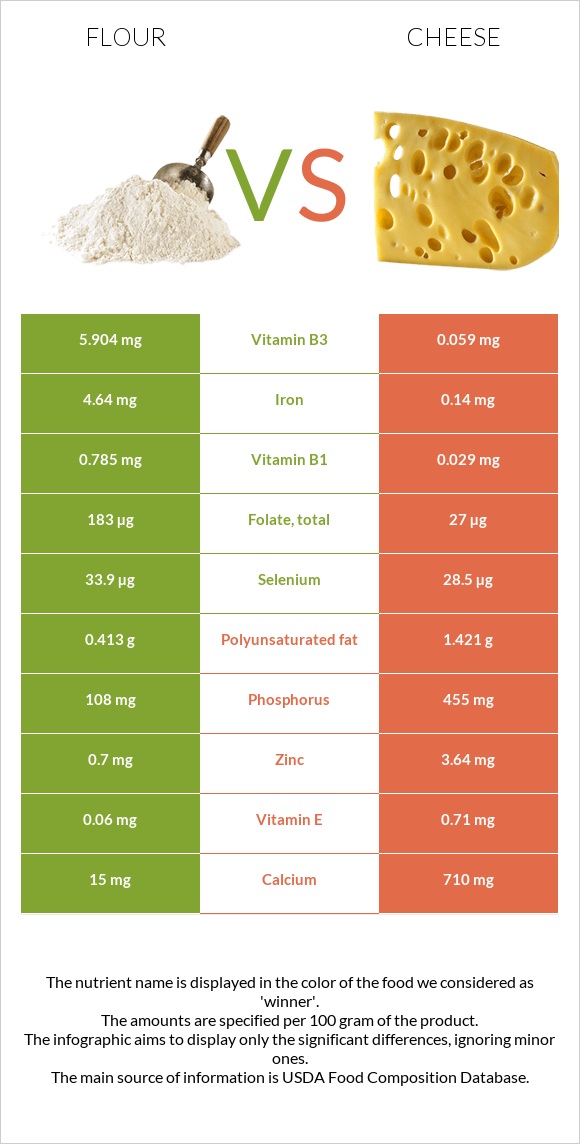
Calcium
15mg
710mg
70%
Vitamin B1
0.785mg
0.029mg
63%
Iron
4.64mg
0.14mg
56%
Fats
0.98g
33.31g
50%
Phosphorus
108mg
455mg
50%
Vitamin B12
0µg
1.1µg
46%
Folate
183µg
27µg
39%
Vitamin A
0µg
330µg
37%
Vitamin B3
5.904mg
0.059mg
37%
Cholesterol
0mg
99mg
33%
Sodium
2mg
653mg
28%
Manganese
0.682mg
0.027mg
28%
Zinc
0.7mg
3.64mg
27%
Protein
10.33g
22.87g
25%
Carbs
76.31g
3.09g
24%
Monounsaturated fat
0.087g
9.246g
23%
Copper
0.144mg
0.03mg
13%
Fiber
2.7g
0g
11%
Selenium
33.9µg
28.5µg
10%
Polyunsaturated fat
0.413g
1.421g
7%
Vitamin B2
0.494mg
0.428mg
5%
Vitamin E
0.06mg
0.71mg
4%
Vitamin D*
0 IU
24 IU
3%
Vitamin D
0µg
0.6µg
3%
Calories
364kcal
404kcal
2%
Vitamin B6
0.044mg
0.066mg
2%
Vitamin K
0.3µg
2.4µg
2%
Magnesium
22mg
27mg
1%
Potassium
107mg
76mg
1%
Vitamin B5
0.438mg
0.41mg
1%
Choline
10.4mg
16.5mg
1%
Protein per 100 calories
2.8g
5.7g
N/A
Calories per 10 g protein
352kcal
177kcal
N/A
Weight per 100 calories
27g
25g
N/A
Unsaturated / Saturated Fat ratio
3.2
0.57
N/A
Net carbs
73.61g
3.09g
N/A
Sugar
0.27g
0.48g
N/A
Trans fat
0.917g
N/A
Tryptophan
0.127mg
0.547mg
0%
Threonine
0.281mg
1.044mg
0%
Isoleucine
0.357mg
1.206mg
0%
Leucine
0.71mg
1.939mg
0%
Lysine
0.228mg
1.025mg
0%
Methionine
0.183mg
0.547mg
0%
Phenylalanine
0.52mg
1.074mg
0%
Valine
0.415mg
1.404mg
0%
Histidine
0.23mg
0.547mg
0%
Omega-3 - EPA
0g
0.01g
N/A
Omega-3 - DHA
0g
0.001g
N/A
Omega-3 - DPA
0g
0.017g
N/A
Omega-6 - Eicosadienoic acid
0.007g
N/A
Macronutrient Comparison
Macronutrient breakdown side-by-side comparison
1
10%
76%
12%
Protein:
10.33 g
Fats:
0.98 g
Carbs:
76.31 g
Water:
11.92 g
Other:
0.46 g
4
23%
33%
3%
37%
4%
Protein:
22.87 g
Fats:
33.31 g
Carbs:
3.09 g
Water:
37.02 g
Other:
3.71 g
Contains
more
Carbs Carbs
+2369.6%
Contains
more
Protein Protein
+121.4%
Contains
more
Fats Fats
+3299%
Contains
more
Water Water
+210.6%
Contains
more
Other Other
+706.5%
Fat Type Comparison
Fat type breakdown side-by-side comparison
1
24%
13%
63%
Saturated fat:
Sat. Fat
0.155 g
Monounsaturated fat:
Mono. Fat
0.087 g
Polyunsaturated fat:
Poly. Fat
0.413 g
2
64%
31%
5%
Saturated fat:
Sat. Fat
18.867 g
Monounsaturated fat:
Mono. Fat
9.246 g
Polyunsaturated fat:
Poly. Fat
1.421 g
Contains
less
Sat. Fat Saturated fat
-99.2%
Contains
more
Mono. Fat Monounsaturated fat
+10527.6%
Contains
more
Poly. Fat Polyunsaturated fat
+244.1%