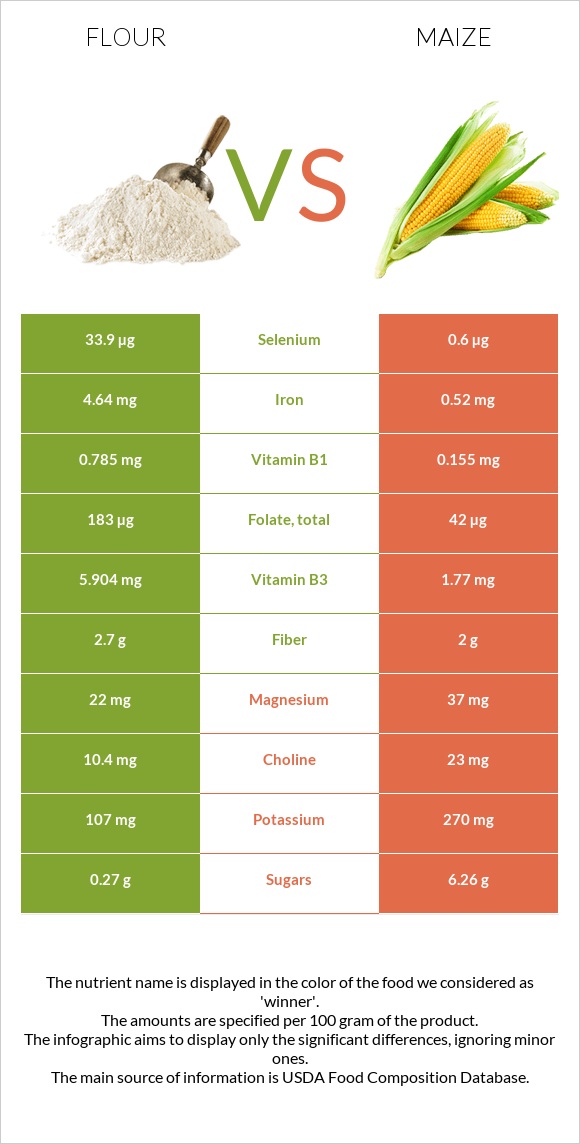
How are flour and corn different? Flour is higher in selenium, vitamin B1, iron, folate, vitamin B2, vitamin B3, manganese, and copper; however, corn is richer in vitamin B6 and vitamin B5. Daily need coverage for selenium for flour is 61% higher. Flour contains 10 times more iron than corn. While flour contains 4.64mg of iron, corn contains only 0.45mg. Corn has a lower glycemic index (52) than flour (72). Wheat flour, white, all-purpose, enriched, bleached and Corn, sweet, yellow, cooked, boiled, drained, without salt are the varieties used in this article.
Infographic
Mineral Comparison
Mineral comparison score is based on the number of minerals by which one or the other food is richer. The "coverage" charts below show how much of the daily needs can be covered by 300 grams of the food.
7
100 g
300 g
1 cup - 125g
Magnesium
Magnesium
Calcium
Calcium
Potassium
Potassium
Iron
Iron
Copper
Copper
Zinc
Zinc
Phosphorus
Phosphorus
Sodium
Sodium
Manganese
Manganese
Selenium
Selenium
16%
4.5%
9.4%
174%
48%
19%
46%
0.26%
89%
185%
3
100 g
300 g
1 baby ear - 8g 1 ear small (5-1/2" to 6-1/2" long) - 89g 1 ear medium (6-3/4" to 7-1/2" long) - 103g 1 ear large (7-3/4" to 9" long) - 118g 1 cup cut - 149g
Magnesium
Magnesium
Calcium
Calcium
Potassium
Potassium
Iron
Iron
Copper
Copper
Zinc
Zinc
Phosphorus
Phosphorus
Sodium
Sodium
Manganese
Manganese
Selenium
Selenium
19%
0.9%
19%
17%
16%
17%
33%
0.13%
22%
1.1%
Vitamin Comparison
Vitamin comparison score is based on the number of vitamins by which one or the other food is richer. The "coverage" charts below show how much of the daily needs can be covered by 300 grams of the food.
4
100 g
300 g
1 cup - 125g
Vitamin C
Vit. C
Vitamin D
Vit. D
Vitamin A
Vit. A
Vitamin E
Vit. E
Vitamin B1
Vit. B1
Vitamin B2
Vit. B2
Vitamin B3
Vit. B3
Vitamin B5
Vit. B5
Vitamin B6
Vit. B6
Vitamin B12
Vit. B12
Vitamin K
Vit. K
Folate
Folate
0%
0%
0%
1.2%
196%
114%
111%
26%
10%
0%
0.75%
137%
6
100 g
300 g
1 baby ear - 8g 1 ear small (5-1/2" to 6-1/2" long) - 89g 1 ear medium (6-3/4" to 7-1/2" long) - 103g 1 ear large (7-3/4" to 9" long) - 118g 1 cup cut - 149g
Vitamin C
Vit. C
Vitamin D
Vit. D
Vitamin A
Vit. A
Vitamin E
Vit. E
Vitamin B1
Vit. B1
Vitamin B2
Vit. B2
Vitamin B3
Vit. B3
Vitamin B5
Vit. B5
Vitamin B6
Vit. B6
Vitamin B12
Vit. B12
Vitamin K
Vit. K
Folate
Folate
18%
0%
4.3%
1.8%
23%
13%
32%
48%
32%
0%
1%
17%
All nutrients comparison - raw data values
Nutrient
DV% diff.
Selenium
33.9µg
0.2µg
61%
Vitamin B1
0.785mg
0.093mg
58%
Iron
4.64mg
0.45mg
52%
Folate
183µg
23µg
40%
Vitamin B2
0.494mg
0.057mg
34%
Vitamin B3
5.904mg
1.683mg
26%
Manganese
0.682mg
0.167mg
22%
Carbs
76.31g
20.98g
18%
Protein
10.33g
3.41g
14%
Calories
364kcal
96kcal
13%
Copper
0.144mg
0.049mg
11%
Vitamin B5
0.438mg
0.792mg
7%
Vitamin B6
0.044mg
0.139mg
7%
Vitamin C
0mg
5.5mg
6%
Phosphorus
108mg
77mg
4%
Potassium
107mg
218mg
3%
Starch
7.17g
3%
Choline
10.4mg
29.1mg
3%
Fats
0.98g
1.5g
1%
Magnesium
22mg
26mg
1%
Calcium
15mg
3mg
1%
Fiber
2.7g
2.4g
1%
Zinc
0.7mg
0.62mg
1%
Vitamin A
0µg
13µg
1%
Monounsaturated fat
0.087g
0.374g
1%
Polyunsaturated fat
0.413g
0.603g
1%
Fructose
0.79g
1%
Protein per 100 calories
2.8g
3.6g
N/A
Calories per 10 g protein
352kcal
282kcal
N/A
Weight per 100 calories
27g
104g
N/A
Net carbs
73.61g
18.58g
N/A
Sugar
0.27g
4.54g
N/A
Sodium
2mg
1mg
0%
Vitamin E
0.06mg
0.09mg
0%
Vitamin K
0.3µg
0.4µg
0%
Saturated fat
0.155g
0.197g
0%
Tryptophan
0.127mg
0.023mg
0%
Threonine
0.281mg
0.133mg
0%
Isoleucine
0.357mg
0.133mg
0%
Leucine
0.71mg
0.358mg
0%
Lysine
0.228mg
0.141mg
0%
Methionine
0.183mg
0.069mg
0%
Phenylalanine
0.52mg
0.155mg
0%
Valine
0.415mg
0.191mg
0%
Histidine
0.23mg
0.091mg
0%
Macronutrient Comparison
Macronutrient breakdown side-by-side comparison
2
10%
76%
12%
Protein:
10.33 g
Fats:
0.98 g
Carbs:
76.31 g
Water:
11.92 g
Other:
0.46 g
3
3%
21%
73%
Protein:
3.41 g
Fats:
1.5 g
Carbs:
20.98 g
Water:
73.41 g
Other:
0.7 g
Contains
more
Protein Protein
+202.9%
Contains
more
Carbs Carbs
+263.7%
Contains
more
Fats Fats
+53.1%
Contains
more
Water Water
+515.9%
Contains
more
Other Other
+52.2%
Fat Type Comparison
Fat type breakdown side-by-side comparison
1
24%
13%
63%
Saturated fat:
Sat. Fat
0.155 g
Monounsaturated fat:
Mono. Fat
0.087 g
Polyunsaturated fat:
Poly. Fat
0.413 g
2
17%
32%
51%
Saturated fat:
Sat. Fat
0.197 g
Monounsaturated fat:
Mono. Fat
0.374 g
Polyunsaturated fat:
Poly. Fat
0.603 g
Contains
less
Sat. Fat Saturated fat
-21.3%
Contains
more
Mono. Fat Monounsaturated fat
+329.9%
Contains
more
Poly. Fat Polyunsaturated fat
+46%