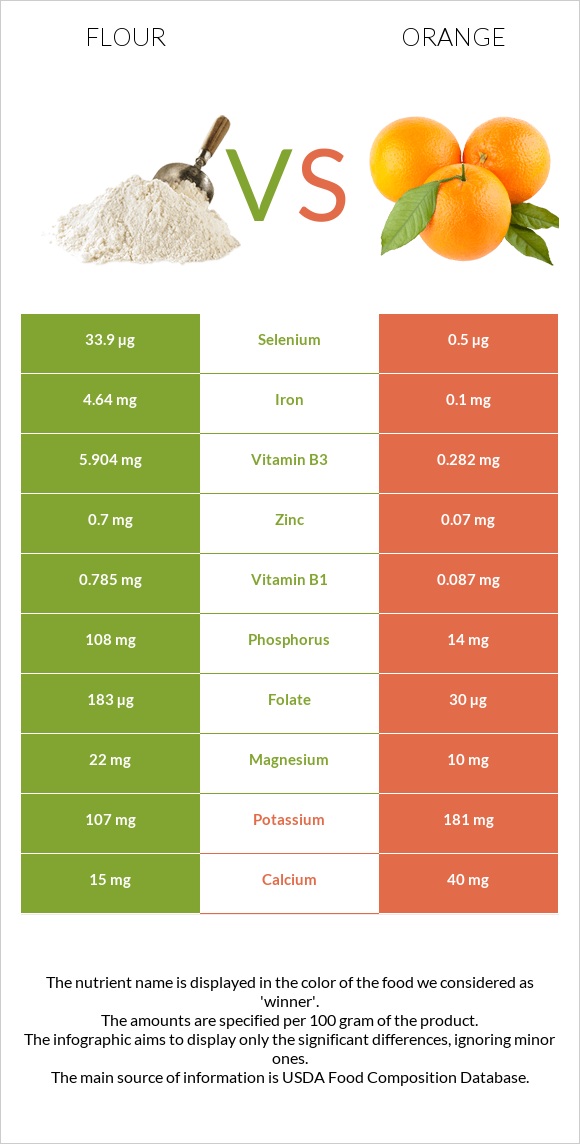
Differences between flour and oranges Flour is higher in selenium, vitamin B1, iron, folate, vitamin B3, vitamin B2, manganese, phosphorus, and copper; however, oranges are richer in vitamin C. Flour's daily need coverage for selenium is 61% higher. Flour has 46 times more iron than oranges. While flour has 4.64mg of iron, oranges have only 0.1mg. Oranges have a lower glycemic index (45) than flour (72). The food types used in this comparison are Wheat flour, white, all-purpose, enriched, bleached and Oranges, raw, all commercial varieties .
Infographic
Mineral Comparison
Mineral comparison score is based on the number of minerals by which one or the other food is richer. The "coverage" charts below show how much of the daily needs can be covered by 300 grams of the food.
7
100 g
300 g
1 cup - 125g
Magnesium
Magnesium
Calcium
Calcium
Potassium
Potassium
Iron
Iron
Copper
Copper
Zinc
Zinc
Phosphorus
Phosphorus
Sodium
Sodium
Manganese
Manganese
Selenium
Selenium
16%
4.5%
9.4%
174%
48%
19%
46%
0.26%
89%
185%
3
100 g
300 g
1 small (2-3/8" dia) - 96g 1 fruit (2-5/8" dia) - 131g 1 cup, sections - 180g 1 large (3-1/16" dia) - 184g
Magnesium
Magnesium
Calcium
Calcium
Potassium
Potassium
Iron
Iron
Copper
Copper
Zinc
Zinc
Phosphorus
Phosphorus
Sodium
Sodium
Manganese
Manganese
Selenium
Selenium
7.1%
12%
16%
3.8%
15%
1.9%
6%
0%
3.3%
2.7%
Vitamin Comparison
Vitamin comparison score is based on the number of vitamins by which one or the other food is richer. The "coverage" charts below show how much of the daily needs can be covered by 300 grams of the food.
6
100 g
300 g
1 cup - 125g
Vitamin C
Vit. C
Vitamin D
Vit. D
Vitamin A
Vit. A
Vitamin E
Vit. E
Vitamin B1
Vit. B1
Vitamin B2
Vit. B2
Vitamin B3
Vit. B3
Vitamin B5
Vit. B5
Vitamin B6
Vit. B6
Vitamin B12
Vit. B12
Vitamin K
Vit. K
Folate
Folate
0%
0%
0%
1.2%
196%
114%
111%
26%
10%
0%
0.75%
137%
4
100 g
300 g
1 small (2-3/8" dia) - 96g 1 fruit (2-5/8" dia) - 131g 1 cup, sections - 180g 1 large (3-1/16" dia) - 184g
Vitamin C
Vit. C
Vitamin D
Vit. D
Vitamin A
Vit. A
Vitamin E
Vit. E
Vitamin B1
Vit. B1
Vitamin B2
Vit. B2
Vitamin B3
Vit. B3
Vitamin B5
Vit. B5
Vitamin B6
Vit. B6
Vitamin B12
Vit. B12
Vitamin K
Vit. K
Folate
Folate
177%
0%
3.7%
3.6%
22%
9.2%
5.3%
15%
14%
0%
0%
23%
All nutrients comparison - raw data values
Nutrient
DV% diff.
Selenium
33.9µg
0.5µg
61%
Vitamin C
0mg
53.2mg
59%
Vitamin B1
0.785mg
0.087mg
58%
Iron
4.64mg
0.1mg
57%
Folate
183µg
30µg
38%
Vitamin B2
0.494mg
0.04mg
35%
Vitamin B3
5.904mg
0.282mg
35%
Manganese
0.682mg
0.025mg
29%
Carbs
76.31g
11.75g
22%
Protein
10.33g
0.94g
19%
Calories
364kcal
47kcal
16%
Phosphorus
108mg
14mg
13%
Copper
0.144mg
0.045mg
11%
Zinc
0.7mg
0.07mg
6%
Vitamin B5
0.438mg
0.25mg
4%
Magnesium
22mg
10mg
3%
Calcium
15mg
40mg
3%
Polyunsaturated fat
0.413g
0.025g
3%
Potassium
107mg
181mg
2%
Fats
0.98g
0.12g
1%
Fiber
2.7g
2.4g
1%
Vitamin A
0µg
11µg
1%
Vitamin E
0.06mg
0.18mg
1%
Vitamin B6
0.044mg
0.06mg
1%
Saturated fat
0.155g
0.015g
1%
Protein per 100 calories
2.8g
2g
N/A
Calories per 10 g protein
352kcal
500kcal
N/A
Weight per 100 calories
27g
213g
N/A
Net carbs
73.61g
9.35g
N/A
Sugar
0.27g
9.35g
N/A
Sodium
2mg
0mg
0%
Vitamin K
0.3µg
0µg
0%
Choline
10.4mg
8.4mg
0%
Monounsaturated fat
0.087g
0.023g
0%
Tryptophan
0.127mg
0.009mg
0%
Threonine
0.281mg
0.015mg
0%
Isoleucine
0.357mg
0.025mg
0%
Leucine
0.71mg
0.023mg
0%
Lysine
0.228mg
0.047mg
0%
Methionine
0.183mg
0.02mg
0%
Phenylalanine
0.52mg
0.031mg
0%
Valine
0.415mg
0.04mg
0%
Histidine
0.23mg
0.018mg
0%
Macronutrient Comparison
Macronutrient breakdown side-by-side comparison
4
10%
76%
12%
Protein:
10.33 g
Fats:
0.98 g
Carbs:
76.31 g
Water:
11.92 g
Other:
0.46 g
1
12%
87%
Protein:
0.94 g
Fats:
0.12 g
Carbs:
11.75 g
Water:
86.75 g
Other:
0.44 g
Contains
more
Protein Protein
+998.9%
Contains
more
Fats Fats
+716.7%
Contains
more
Carbs Carbs
+549.4%
Contains
more
Water Water
+627.8%
Fat Type Comparison
Fat type breakdown side-by-side comparison
2
24%
13%
63%
Saturated fat:
Sat. Fat
0.155 g
Monounsaturated fat:
Mono. Fat
0.087 g
Polyunsaturated fat:
Poly. Fat
0.413 g
1
24%
37%
40%
Saturated fat:
Sat. Fat
0.015 g
Monounsaturated fat:
Mono. Fat
0.023 g
Polyunsaturated fat:
Poly. Fat
0.025 g
Contains
more
Mono. Fat Monounsaturated fat
+278.3%
Contains
more
Poly. Fat Polyunsaturated fat
+1552%
Contains
less
Sat. Fat Saturated fat
-90.3%