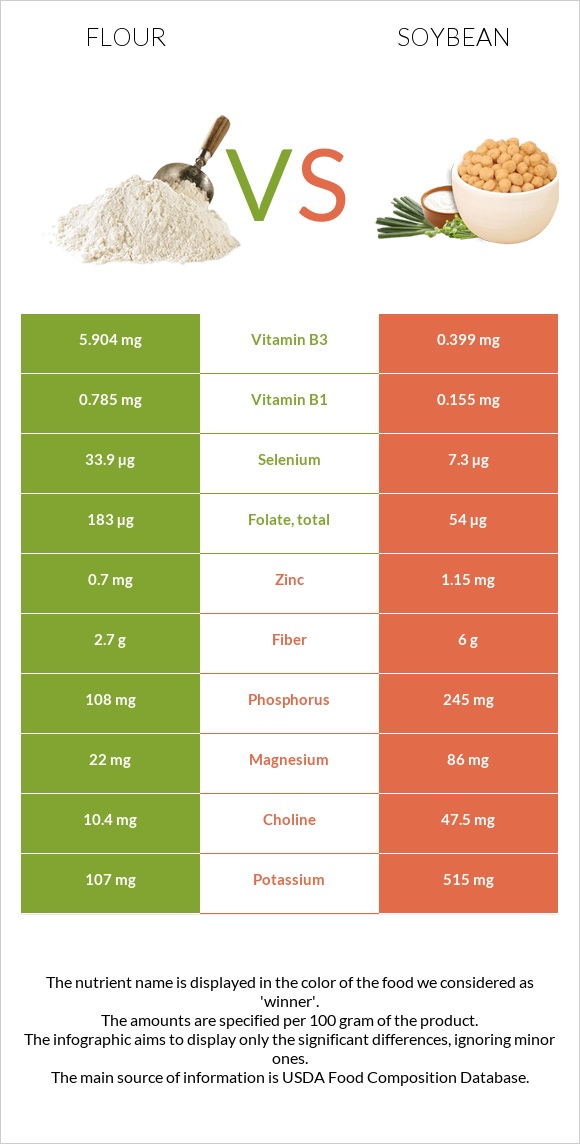
Significant differences between flour and soybeans Flour has more vitamin B1, selenium, vitamin B3, folate, and vitamin B2; however, soybeans are richer in copper, phosphorus, vitamin K, magnesium, and vitamin B6. Flour covers your daily vitamin B1 needs 53% more than soybeans. Soybeans have 15 times less vitamin B3 than flour. Flour has 5.904mg of vitamin B3, while soybeans have 0.399mg. Flour has a higher glycemic index. The glycemic index of flour is 72, while the glycemic index of soybeans is 14. Specific food types used in this comparison are Wheat flour, white, all-purpose, enriched, bleached and Soybeans, mature cooked, boiled, without salt .
Infographic
Mineral Comparison
Mineral comparison score is based on the number of minerals by which one or the other food is richer. The "coverage" charts below show how much of the daily needs can be covered by 300 grams of the food.
1
100 g
300 g
1 cup - 125g
Magnesium
Magnesium
Calcium
Calcium
Potassium
Potassium
Iron
Iron
Copper
Copper
Zinc
Zinc
Phosphorus
Phosphorus
Sodium
Sodium
Manganese
Manganese
Selenium
Selenium
16%
4.5%
9.4%
174%
48%
19%
46%
0.26%
89%
185%
9
100 g
300 g
1 tbsp - 10.7g 1 cup - 172g
Magnesium
Magnesium
Calcium
Calcium
Potassium
Potassium
Iron
Iron
Copper
Copper
Zinc
Zinc
Phosphorus
Phosphorus
Sodium
Sodium
Manganese
Manganese
Selenium
Selenium
61%
31%
45%
193%
136%
31%
105%
0.13%
107%
40%
Vitamin Comparison
Vitamin comparison score is based on the number of vitamins by which one or the other food is richer. The "coverage" charts below show how much of the daily needs can be covered by 300 grams of the food.
5
100 g
300 g
1 cup - 125g
Vitamin C
Vit. C
Vitamin D
Vit. D
Vitamin A
Vit. A
Vitamin E
Vit. E
Vitamin B1
Vit. B1
Vitamin B2
Vit. B2
Vitamin B3
Vit. B3
Vitamin B5
Vit. B5
Vitamin B6
Vit. B6
Vitamin B12
Vit. B12
Vitamin K
Vit. K
Folate
Folate
0%
0%
0%
1.2%
196%
114%
111%
26%
10%
0%
0.75%
137%
4
100 g
300 g
1 tbsp - 10.7g 1 cup - 172g
Vitamin C
Vit. C
Vitamin D
Vit. D
Vitamin A
Vit. A
Vitamin E
Vit. E
Vitamin B1
Vit. B1
Vitamin B2
Vit. B2
Vitamin B3
Vit. B3
Vitamin B5
Vit. B5
Vitamin B6
Vit. B6
Vitamin B12
Vit. B12
Vitamin K
Vit. K
Folate
Folate
5.7%
0%
0%
7%
39%
66%
7.5%
11%
54%
0%
48%
41%
All nutrients comparison - raw data values
Nutrient
DV% diff.
Vitamin B1
0.785mg
0.155mg
53%
Selenium
33.9µg
7.3µg
48%
Vitamin B3
5.904mg
0.399mg
34%
Folate
183µg
54µg
32%
Polyunsaturated fat
0.413g
5.064g
31%
Copper
0.144mg
0.407mg
29%
Carbs
76.31g
8.36g
23%
Phosphorus
108mg
245mg
20%
Protein
10.33g
18.21g
16%
Vitamin B2
0.494mg
0.285mg
16%
Vitamin K
0.3µg
19.2µg
16%
Magnesium
22mg
86mg
15%
Vitamin B6
0.044mg
0.234mg
15%
Fiber
2.7g
6g
13%
Fats
0.98g
8.97g
12%
Potassium
107mg
515mg
12%
Calories
364kcal
172kcal
10%
Calcium
15mg
102mg
9%
Choline
10.4mg
47.5mg
7%
Iron
4.64mg
5.14mg
6%
Manganese
0.682mg
0.824mg
6%
Vitamin B5
0.438mg
0.179mg
5%
Saturated fat
0.155g
1.297g
5%
Monounsaturated fat
0.087g
1.981g
5%
Zinc
0.7mg
1.15mg
4%
Vitamin C
0mg
1.7mg
2%
Vitamin E
0.06mg
0.35mg
2%
Protein per 100 calories
2.8g
11g
N/A
Calories per 10 g protein
352kcal
94kcal
N/A
Weight per 100 calories
27g
58g
N/A
Unsaturated / Saturated Fat ratio
3.2
5.4
N/A
Net carbs
73.61g
2.36g
N/A
Sugar
0.27g
3g
N/A
Sodium
2mg
1mg
0%
Tryptophan
0.127mg
0.242mg
0%
Threonine
0.281mg
0.723mg
0%
Isoleucine
0.357mg
0.807mg
0%
Leucine
0.71mg
1.355mg
0%
Lysine
0.228mg
1.108mg
0%
Methionine
0.183mg
0.224mg
0%
Phenylalanine
0.52mg
0.869mg
0%
Valine
0.415mg
0.831mg
0%
Histidine
0.23mg
0.449mg
0%
Macronutrient Comparison
Macronutrient breakdown side-by-side comparison
1
10%
76%
12%
Protein:
10.33 g
Fats:
0.98 g
Carbs:
76.31 g
Water:
11.92 g
Other:
0.46 g
4
18%
9%
8%
63%
2%
Protein:
18.21 g
Fats:
8.97 g
Carbs:
8.36 g
Water:
62.55 g
Other:
1.91 g
Contains
more
Carbs Carbs
+812.8%
Contains
more
Protein Protein
+76.3%
Contains
more
Fats Fats
+815.3%
Contains
more
Water Water
+424.7%
Contains
more
Other Other
+315.2%
Fat Type Comparison
Fat type breakdown side-by-side comparison
1
24%
13%
63%
Saturated fat:
Sat. Fat
0.155 g
Monounsaturated fat:
Mono. Fat
0.087 g
Polyunsaturated fat:
Poly. Fat
0.413 g
2
16%
24%
61%
Saturated fat:
Sat. Fat
1.297 g
Monounsaturated fat:
Mono. Fat
1.981 g
Polyunsaturated fat:
Poly. Fat
5.064 g
Contains
less
Sat. Fat Saturated fat
-88%
Contains
more
Mono. Fat Monounsaturated fat
+2177%
Contains
more
Poly. Fat Polyunsaturated fat
+1126.2%