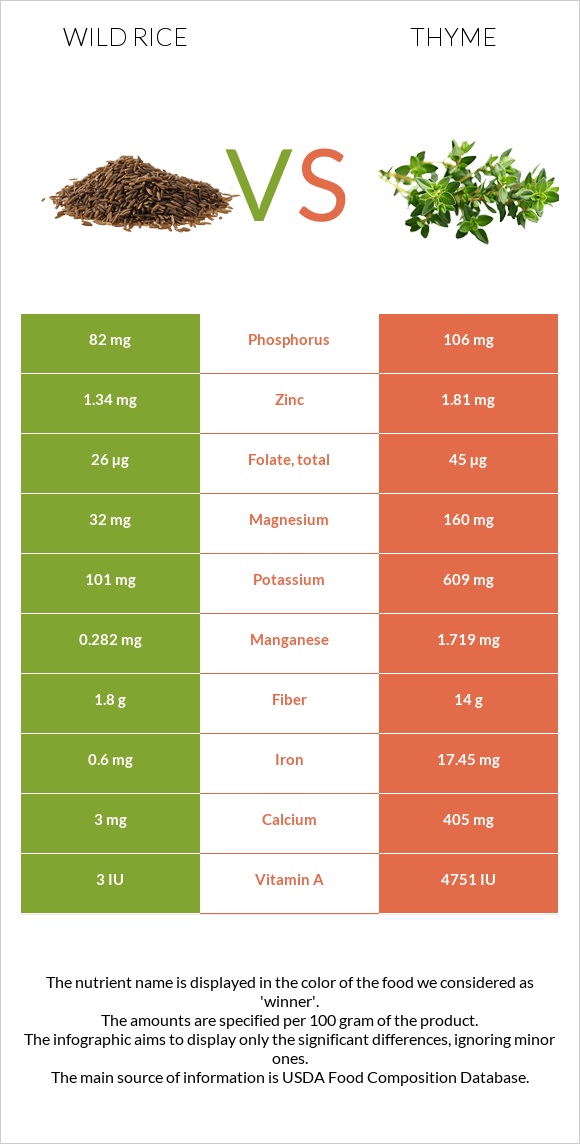
How are wild rice and thyme different? Wild rice contains less iron, vitamin C, vitamin A, manganese, fiber, copper, calcium, magnesium, vitamin B2, and vitamin B6 than thyme. Thyme covers your daily need for iron, 211% more than wild rice. Wild rice has a higher glycemic index. The glycemic index of wild rice is 57, while the glycemic index of thyme is 45. Wild rice, cooked and Thyme, fresh types were used in this article.
Infographic
Mineral Comparison
Mineral comparison score is based on the number of minerals by which one or the other food is richer. The "coverage" charts below show how much of the daily needs can be covered by 300 grams of the food.
2
100 g
300 g
1 cup - 164g
Magnesium
Magnesium
Calcium
Calcium
Potassium
Potassium
Iron
Iron
Copper
Copper
Zinc
Zinc
Phosphorus
Phosphorus
Sodium
Sodium
Manganese
Manganese
Selenium
Selenium
23%
0.9%
8.9%
23%
40%
37%
35%
0.39%
37%
4.4%
8
100 g
300 g
0.5 tsp - 0.4g 1 tsp - 0.8g
Magnesium
Magnesium
Calcium
Calcium
Potassium
Potassium
Iron
Iron
Copper
Copper
Zinc
Zinc
Phosphorus
Phosphorus
Sodium
Sodium
Manganese
Manganese
Selenium
Selenium
114%
122%
54%
654%
185%
49%
45%
1.2%
224%
0%
Vitamin Comparison
Vitamin comparison score is based on the number of vitamins by which one or the other food is richer. The "coverage" charts below show how much of the daily needs can be covered by 300 grams of the food.
2
100 g
300 g
1 cup - 164g
Vitamin C
Vit. C
Vitamin D
Vit. D
Vitamin A
Vit. A
Vitamin E
Vit. E
Vitamin B1
Vit. B1
Vitamin B2
Vit. B2
Vitamin B3
Vit. B3
Vitamin B5
Vit. B5
Vitamin B6
Vit. B6
Vitamin B12
Vit. B12
Vitamin K
Vit. K
Folate
Folate
0%
0%
0%
4.8%
13%
20%
24%
9.2%
31%
0%
1.3%
20%
7
100 g
300 g
0.5 tsp - 0.4g 1 tsp - 0.8g
Vitamin C
Vit. C
Vitamin D
Vit. D
Vitamin A
Vit. A
Vitamin E
Vit. E
Vitamin B1
Vit. B1
Vitamin B2
Vit. B2
Vitamin B3
Vit. B3
Vitamin B5
Vit. B5
Vitamin B6
Vit. B6
Vitamin B12
Vit. B12
Vitamin K
Vit. K
Folate
Folate
534%
0%
79%
0%
12%
109%
34%
25%
80%
0%
0%
34%
All nutrients comparison - raw data values
Nutrient
DV% diff.
Iron
0.6mg
17.45mg
211%
Vitamin C
0mg
160.1mg
178%
Manganese
0.282mg
1.719mg
62%
Fiber
1.8g
14g
49%
Copper
0.121mg
0.555mg
48%
Calcium
3mg
405mg
40%
Magnesium
32mg
160mg
30%
Vitamin B2
0.087mg
0.471mg
30%
Vitamin A
0µg
238µg
26%
Vitamin B6
0.135mg
0.348mg
16%
Potassium
101mg
609mg
15%
Vitamin B5
0.154mg
0.409mg
5%
Folate
26µg
45µg
5%
Zinc
1.34mg
1.81mg
4%
Protein
3.99g
5.56g
3%
Phosphorus
82mg
106mg
3%
Vitamin B3
1.287mg
1.824mg
3%
Fats
0.34g
1.68g
2%
Vitamin E
0.24mg
2%
Choline
10.2mg
2%
Saturated fat
0.049g
0.467g
2%
Polyunsaturated fat
0.213g
0.532g
2%
Carbs
21.34g
24.45g
1%
Selenium
0.8µg
1%
Calories
101kcal
101kcal
0%
Protein per 100 calories
4g
5.5g
N/A
Calories per 10 g protein
253kcal
182kcal
N/A
Weight per 100 calories
99g
99g
N/A
Net carbs
19.54g
10.45g
N/A
Sugar
0.73g
N/A
Sodium
3mg
9mg
0%
Vitamin B1
0.052mg
0.048mg
0%
Vitamin K
0.5µg
0%
Monounsaturated fat
0.05g
0.081g
0%
Tryptophan
0.049mg
0.114mg
0%
Threonine
0.127mg
0.154mg
0%
Isoleucine
0.167mg
0.285mg
0%
Leucine
0.276mg
0.262mg
0%
Lysine
0.17mg
0.126mg
0%
Methionine
0.119mg
0%
Phenylalanine
0.195mg
0%
Valine
0.232mg
0.307mg
0%
Histidine
0.104mg
0%
Fructose
0.2g
0%
Macronutrient Comparison
Macronutrient breakdown side-by-side comparison
1
4%
21%
74%
Protein:
3.99 g
Fats:
0.34 g
Carbs:
21.34 g
Water:
73.93 g
Other:
0.4 g
4
6%
2%
24%
65%
3%
Protein:
5.56 g
Fats:
1.68 g
Carbs:
24.45 g
Water:
65.11 g
Other:
3.2 g
Contains
more
Water Water
+13.5%
Contains
more
Protein Protein
+39.3%
Contains
more
Fats Fats
+394.1%
Contains
more
Carbs Carbs
+14.6%
Contains
more
Other Other
+700%
Fat Type Comparison
Fat type breakdown side-by-side comparison
1
16%
16%
68%
Saturated fat:
Sat. Fat
0.049 g
Monounsaturated fat:
Mono. Fat
0.05 g
Polyunsaturated fat:
Poly. Fat
0.213 g
2
43%
8%
49%
Saturated fat:
Sat. Fat
0.467 g
Monounsaturated fat:
Mono. Fat
0.081 g
Polyunsaturated fat:
Poly. Fat
0.532 g
Contains
less
Sat. Fat Saturated fat
-89.5%
Contains
more
Mono. Fat Monounsaturated fat
+62%
Contains
more
Poly. Fat Polyunsaturated fat
+149.8%