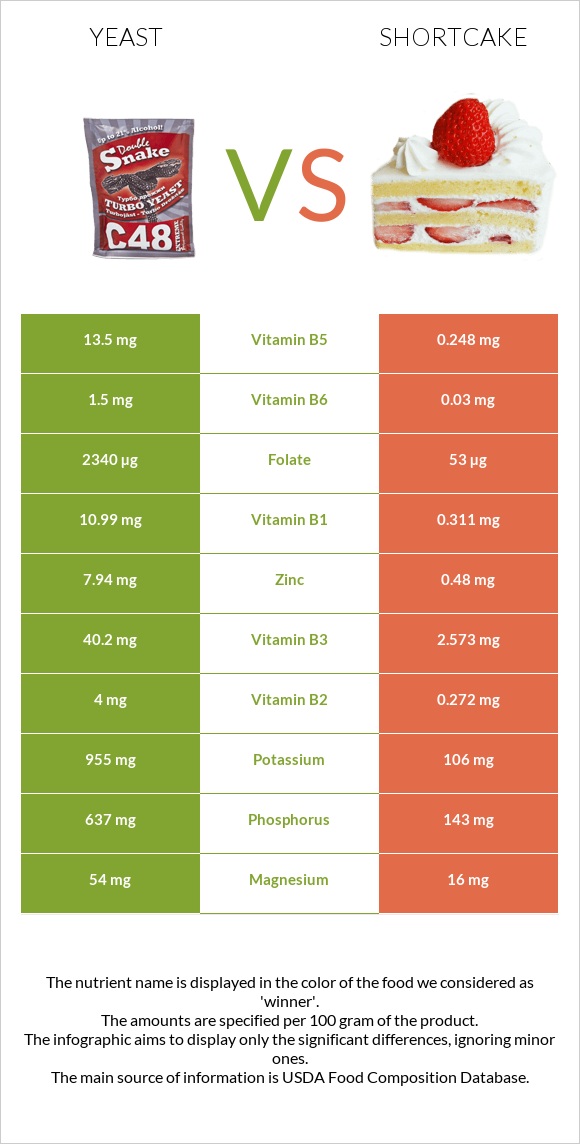
Differences between yeast and shortcake Shortcake contains less vitamin B1, folate, vitamin B2, vitamin B5, vitamin B3, vitamin B6, phosphorus, zinc, copper, and potassium than yeast. Yeast's daily need coverage for vitamin B1 is 890% higher. Shortcake contains 54 times less vitamin B5 than yeast. Yeast contains 13.5mg of vitamin B5, while shortcake contains 0.248mg. The food types used in this comparison are Leavening agents, yeast, baker's, active dry and Cake, shortcake, biscuit-type, prepared from recipe .
Infographic
Mineral Comparison
Mineral comparison score is based on the number of minerals by which one or the other food is richer. The "coverage" charts below show how much of the daily needs can be covered by 300 grams of the food.
6
100 g
300 g
1 tsp - 4g 1 packet - 7.2g 1 tbsp - 12g
Magnesium
Magnesium
Calcium
Calcium
Potassium
Potassium
Iron
Iron
Copper
Copper
Zinc
Zinc
Phosphorus
Phosphorus
Sodium
Sodium
Manganese
Manganese
Selenium
Selenium
39%
9%
84%
81%
145%
217%
273%
6.7%
41%
43%
3
100 g
300 g
1 oz - 28.35g
Magnesium
Magnesium
Calcium
Calcium
Potassium
Potassium
Iron
Iron
Copper
Copper
Zinc
Zinc
Phosphorus
Phosphorus
Sodium
Sodium
Manganese
Manganese
Selenium
Selenium
11%
62%
9.4%
95%
25%
13%
61%
66%
43%
93%
Vitamin Comparison
Vitamin comparison score is based on the number of vitamins by which one or the other food is richer. The "coverage" charts below show how much of the daily needs can be covered by 300 grams of the food.
8
100 g
300 g
1 tsp - 4g 1 packet - 7.2g 1 tbsp - 12g
Vitamin C
Vit. C
Vitamin D
Vit. D
Vitamin A
Vit. A
Vitamin E
Vit. E
Vitamin B1
Vit. B1
Vitamin B2
Vit. B2
Vitamin B3
Vit. B3
Vitamin B5
Vit. B5
Vitamin B6
Vit. B6
Vitamin B12
Vit. B12
Vitamin K
Vit. K
Folate
Folate
1%
0%
0%
0%
2748%
923%
754%
810%
346%
8.8%
1%
1755%
1
100 g
300 g
1 oz - 28.35g
Vitamin C
Vit. C
Vitamin D
Vit. D
Vitamin A
Vit. A
Vitamin E
Vit. E
Vitamin B1
Vit. B1
Vitamin B2
Vit. B2
Vitamin B3
Vit. B3
Vitamin B5
Vit. B5
Vitamin B6
Vit. B6
Vitamin B12
Vit. B12
Vitamin K
Vit. K
Folate
Folate
0.67%
0%
6%
0%
78%
63%
48%
15%
6.9%
8.8%
0%
40%
All nutrients comparison - raw data values
Nutrient
DV% diff.
Vitamin B1
10.99mg
0.311mg
890%
Folate
2340µg
53µg
572%
Vitamin B2
4mg
0.272mg
287%
Vitamin B5
13.5mg
0.248mg
265%
Vitamin B3
40.2mg
2.573mg
235%
Vitamin B6
1.5mg
0.03mg
113%
Fiber
26.9g
108%
Phosphorus
637mg
143mg
71%
Protein
40.44g
6.1g
69%
Zinc
7.94mg
0.48mg
68%
Copper
0.436mg
0.076mg
40%
Potassium
955mg
106mg
25%
Polyunsaturated fat
0.017g
3.632g
24%
Sodium
51mg
506mg
20%
Calcium
30mg
205mg
18%
Selenium
7.9µg
17µg
17%
Saturated fat
1.001g
3.772g
13%
Fats
7.61g
14.2g
10%
Magnesium
54mg
16mg
9%
Choline
32mg
6%
Iron
2.17mg
2.54mg
5%
Monounsaturated fat
4.309g
6.045g
4%
Carbs
41.22g
48.5g
2%
Vitamin A
0µg
18µg
2%
Calories
325kcal
346kcal
1%
Cholesterol
0mg
3mg
1%
Manganese
0.312mg
0.33mg
1%
Protein per 100 calories
12g
1.8g
N/A
Calories per 10 g protein
80kcal
567kcal
N/A
Weight per 100 calories
31g
29g
N/A
Unsaturated / Saturated Fat ratio
4.3
2.6
N/A
Vitamin C
0.3mg
0.2mg
0%
Net carbs
14.32g
48.5g
N/A
Vitamin B12
0.07µg
0.07µg
0%
Vitamin K
0.4µg
0%
Tryptophan
0.54mg
0.076mg
0%
Threonine
1.99mg
0.184mg
0%
Isoleucine
1.89mg
0.238mg
0%
Leucine
2.92mg
0.449mg
0%
Lysine
3.28mg
0.197mg
0%
Methionine
0.59mg
0.115mg
0%
Phenylalanine
1.75mg
0.302mg
0%
Valine
2.31mg
0.273mg
0%
Histidine
0.91mg
0.14mg
0%
Macronutrient Comparison
Macronutrient breakdown side-by-side comparison
2
40%
8%
41%
5%
6%
Protein:
40.44 g
Fats:
7.61 g
Carbs:
41.22 g
Water:
5.08 g
Other:
5.65 g
3
6%
14%
49%
28%
3%
Protein:
6.1 g
Fats:
14.2 g
Carbs:
48.5 g
Water:
28.4 g
Other:
2.8 g
Contains
more
Protein Protein
+563%
Contains
more
Other Other
+101.8%
Contains
more
Fats Fats
+86.6%
Contains
more
Carbs Carbs
+17.7%
Contains
more
Water Water
+459.1%
Fat Type Comparison
Fat type breakdown side-by-side comparison
1
19%
81%
Saturated fat:
Sat. Fat
1.001 g
Monounsaturated fat:
Mono. Fat
4.309 g
Polyunsaturated fat:
Poly. Fat
0.017 g
2
28%
45%
27%
Saturated fat:
Sat. Fat
3.772 g
Monounsaturated fat:
Mono. Fat
6.045 g
Polyunsaturated fat:
Poly. Fat
3.632 g
Contains
less
Sat. Fat Saturated fat
-73.5%
Contains
more
Mono. Fat Monounsaturated fat
+40.3%
Contains
more
Poly. Fat Polyunsaturated fat
+21264.7%