Almonds nutrition: calories, carbs, GI, protein, fiber, fats
Nuts, almonds
Medically reviewed by Jack Yacoubian


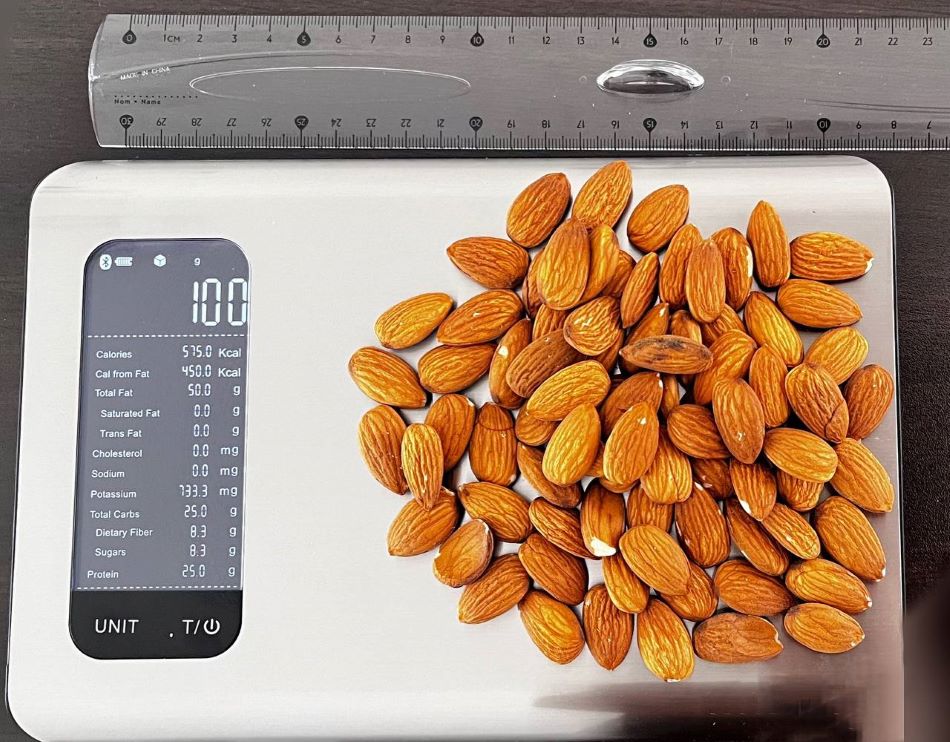
What Do 579 Calories or 100 Grams of Almonds Look Like?
Our team measured how much 100 grams or 579 calories of almonds looks like. The picture below shows that 72 almonds comprise 100 grams or 575-579 calories. That means each almond is about 1.4 grams or around 8 calories.
One serving of almonds (28.35g) contains 164 calories accordingly.
Calorie count can change based on the weight and size of almonds.

Education: General Medicine at YSMU
Last updated: October 31, 2023
Medically reviewed by Jack Yacoubian
Top nutrition facts for Almonds
| Calories ⓘ Calories for selected serving | 579 kcal |
|
Glycemic index ⓘ
Source: Check out our full article on Almonds glycemic index https://www.ijmrhs.com/medical-research/dry-fruits-and-diabetes-mellitus.pdfCheck out our Glycemic index chart page for the full list.
|
0 (low) |
| Net Carbs ⓘ Net Carbs = Total Carbohydrates – Fiber – Sugar Alcohols | 9 grams |
| Default serving size ⓘ Serving sizes are mostly taken from FDA's Reference Amounts Customarily Consumed (RACCs) | 1 oz (23 whole kernels) (28.35 grams) |
| Acidity (Based on PRAL) ⓘ PRAL (Potential renal acid load) is calculated using a formula. On the PRAL scale the higher the positive value, the more is the acidifying effect on the body. The lower the negative value, the higher the alkalinity of the food. 0 is neutral. | 2.3 (acidic) |
| Oxalates ⓘ https://www.sciencedirect.com/science/article/abs/pii/S0889157513000902 | 296 mg |
Almonds calories (kcal)
| Calories for different serving sizes of almonds | Calories | Weight |
|---|---|---|
| Calories in 100 grams | 579 | |
| Calories in 1 almond | 7 | 1.2 g |
| Calories in 1 cup, sliced | 533 | 92 g |
| Calories in 1 cup, ground | 550 | 95 g |
| Calories in 1 cup, slivered | 625 | 108 g |
| Calories in 1 cup, whole | 828 | 143 g |
| Calories for different varieties of almonds | Calories | Weight |
|---|---|---|
| Nuts, almonds (this food) | 579 | 100 g |
| Nuts, almonds, blanched | 590 | 100 g |
| Nuts, almonds, honey roasted, unblanched | 594 | 100 g |
| Nuts, almonds, dry roasted, without salt added | 598 | 100 g |
| Nuts, almonds, dry roasted, with salt added | 598 | 100 g |
| Nuts, almonds, oil roasted, without salt added | 607 | 100 g |
| Nuts, almonds, oil roasted, with salt added | 607 | 100 g |
| Nuts, almonds, oil roasted, with salt added, smoke flavor | 607 | 100 g |
| Nuts, almonds, oil roasted, lightly salted | 607 | 100 g |
Almonds Glycemic index (GI)
Source:
Check out our full article on Almonds glycemic index
https://www.ijmrhs.com/medical-research/dry-fruits-and-diabetes-mellitus.pdfCheck out our Glycemic index chart page for the full list.
Mineral coverage chart
Mineral chart - relative view
Vitamin coverage chart
Vitamin A:
0µg of 900µg
0%
Vitamin E:
77mg of 15mg
513%
Vitamin D:
0µg of 20µg
0%
Vitamin C:
0mg of 90mg
0%
Vitamin B1:
0.62mg of 1mg
51%
Vitamin B2:
3.4mg of 1mg
263%
Vitamin B3:
11mg of 16mg
68%
Vitamin B5:
1.4mg of 5mg
28%
Vitamin B6:
0.41mg of 1mg
32%
Folate:
132µg of 400µg
33%
Vitamin B12:
0µg of 2µg
0%
Vitamin K:
0µg of 120µg
0%
Vitamin chart - relative view
Macronutrients chart
Protein:
Daily Value: 42%
21.2 g of 50 g
21.2 g (42% of DV )
Fats:
Daily Value: 77%
49.9 g of 65 g
49.9 g (77% of DV )
Carbs:
Daily Value: 7%
21.6 g of 300 g
21.6 g (7% of DV )
Water:
Daily Value: 0%
4.4 g of 2,000 g
4.4 g (0% of DV )
Other:
3 g
3 g
Protein quality breakdown
Tryptophan:
633mg of 280mg
226%
Threonine:
1803mg of 1,050mg
172%
Isoleucine:
2253mg of 1,400mg
161%
Leucine:
4419mg of 2,730mg
162%
Lysine:
1704mg of 2,100mg
81%
Methionine:
471mg of 1,050mg
45%
Phenylalanine:
3396mg of 1,750mg
194%
Valine:
2565mg of 1,820mg
141%
Histidine:
1617mg of 700mg
231%
Fat type information
Saturated fat:
3.8 g
Monounsaturated fat:
32 g
Polyunsaturated fat:
12 g
Carbohydrate type breakdown
Starch:
0.72 g
Sucrose:
4 g
Glucose:
0.17 g
Fructose:
0.11 g
Lactose:
0 g
Maltose:
0.04 g
Galactose:
0.07 g
Fiber content ratio for Almonds
Sugar:
4.4 g
Fiber:
13 g
Other:
4.7 g
All nutrients for Almonds per selected serving size (100 g)
| Nutrient | Value | DV% | In TOP % of foods | Comparison |
| Vitamin A | 0µg | 0% | 100% | |
| Calories | 579kcal | 29% | 3% |
12.3 times more than Orange
|
| Protein | 21g | 50% | 22% |
7.5 times more than Broccoli
|
| Fats | 50g | 77% | 3% |
1.5 times more than Cheese
|
| Vitamin C | 0mg | 0% | 100% |
N/A
|
| Net carbs | 9.1g | N/A | 48% |
6 times less than Chocolate
|
| Carbs | 22g | 7% | 33% |
1.3 times less than Rice
|
| Cholesterol | 0mg | 0% | 100% |
N/A
|
| Vitamin D | 0µg | 0% | 100% |
N/A
|
| Magnesium | 270mg | 64% | 10% |
1.9 times more than Almonds
|
| Calcium | 269mg | 27% | 9% |
2.2 times more than Milk
|
| Potassium | 733mg | 22% | 8% |
5 times more than Cucumber
|
| Iron | 3.7mg | 46% | 15% |
1.4 times more than Beef broiled
|
| Sugar | 4.4g | N/A | 50% |
2.1 times less than Coca-Cola
|
| Fiber | 13g | 50% | 9% |
5.2 times more than Orange
|
| Copper | 1mg | 115% | 16% |
7.3 times more than Shiitake
|
| Zinc | 3.1mg | 28% | 29% |
2 times less than Beef broiled
|
| Starch | 0.72g | 0% | 96% |
21.2 times less than Potato
|
| Phosphorus | 481mg | 69% | 10% |
2.6 times more than Chicken meat
|
| Sodium | 1mg | 0% | 98% |
490 times less than White bread
|
| Vitamin E | 26mg | 171% | 33% |
17.6 times more than Kiwi
|
| Selenium | 4.1µg | 7% | 69% | |
| Manganese | 2.2mg | 95% | 27% | |
| Vitamin B1 | 0.21mg | 17% | 34% |
1.3 times less than Pea raw
|
| Vitamin B2 | 1.1mg | 88% | 10% |
8.8 times more than Avocado
|
| Vitamin B3 | 3.6mg | 23% | 45% |
2.6 times less than Turkey meat
|
| Vitamin B5 | 0.47mg | 9% | 60% |
2.4 times less than Sunflower seeds
|
| Vitamin B6 | 0.14mg | 11% | 57% |
1.2 times more than Oats
|
| Vitamin B12 | 0µg | 0% | 100% |
N/A
|
| Vitamin K | 0µg | 0% | 100% |
N/A
|
| Trans fat | 0.02g | N/A | 70% |
992.7 times less than Margarine
|
| Folate | 44µg | 11% | 37% |
1.4 times less than Brussels sprouts
|
| Saturated fat | 3.8g | 19% | 31% |
1.6 times less than Beef broiled
|
| Choline | 52mg | 9% | 65% | |
| Monounsaturated fat | 32g | N/A | 9% |
3.2 times more than Avocado
|
| Polyunsaturated fat | 12g | N/A | 11% |
3.8 times less than Walnut
|
| Tryptophan | 0.21mg | 0% | 63% |
1.4 times less than Chicken meat
|
| Threonine | 0.6mg | 0% | 71% |
1.2 times less than Beef broiled
|
| Isoleucine | 0.75mg | 0% | 68% |
1.2 times less than Salmon raw
|
| Leucine | 1.5mg | 0% | 66% |
1.7 times less than Tuna Bluefin
|
| Lysine | 0.57mg | 0% | 75% |
1.3 times more than Tofu
|
| Methionine | 0.16mg | 0% | 78% |
1.6 times more than Quinoa
|
| Phenylalanine | 1.1mg | 0% | 49% |
1.7 times more than Egg
|
| Valine | 0.86mg | 0% | 68% |
2.4 times less than Soybean raw
|
| Histidine | 0.54mg | 0% | 67% |
1.4 times less than Turkey meat
|
| Fructose | 0.11g | 0% | 92% |
53.6 times less than Apple
|
| Caffeine | 0mg | 0% | 100% | |
| Omega-3 - EPA | 0g | N/A | 100% |
N/A
|
| Omega-3 - DHA | 0g | N/A | 100% |
N/A
|
| Omega-3 - ALA | 0g | N/A | 99% |
3046.7 times less than Canola oil
|
| Omega-3 - DPA | 0g | N/A | 100% |
N/A
|
| Omega-6 - Gamma-linoleic acid | 0g | N/A | 100% | |
| Omega-6 - Eicosadienoic acid | 0g | N/A | 87% | |
| Omega-6 - Linoleic acid | 12g | N/A | 80% |
Equal to Almonds
|
Check out similar food or compare with current
NUTRITION FACTS LABEL
Nutrition Facts
___servings per container
Serving Size ______________
Serving Size ______________
Amount Per 100g
Calories 579
% Daily Value*
77%
Total Fat
50g
17%
Saturated Fat 3.8g
0
Trans Fat
0g
0
Cholesterol 0mg
0.04%
Sodium 1mg
7.2%
Total Carbohydrate
22g
50%
Dietary Fiber
13g
Total Sugars 0g
Includes ? g Added Sugars
Protein
21g
Vitamin D
0mcg
0
Calcium
269mg
27%
Iron
3.7mg
46%
Potassium
733mg
22%
*
The % Daily Value (DV) tells you how much a nutrient in a serving of food contributes to a daily diet. 2,000 calories a day is used for general nutrition advice.
Health checks
ⓘ
Dietary cholesterol is not associated with an increased risk of coronary heart disease in healthy individuals. However, dietary cholesterol is common in foods that are high in harmful saturated fats.
Source
Low in Cholesterol
ⓘ
Trans fat consumption increases the risk of cardiovascular disease and mortality by negatively affecting blood lipid levels.
Source
No Trans Fats
ⓘ
Saturated fat intake can raise total cholesterol and LDL (low-density lipoprotein) levels, leading to an increased risk of atherosclerosis. Dietary guidelines recommend limiting saturated fats to under 10% of calories a day.
Source
Low in Saturated Fats
ⓘ
While the consumption of moderate amounts of added sugars is not detrimental to health, an excessive intake can increase the risk of obesity, and therefore, diabetes.
Source
Low in Sugars
Almonds nutrition infographic
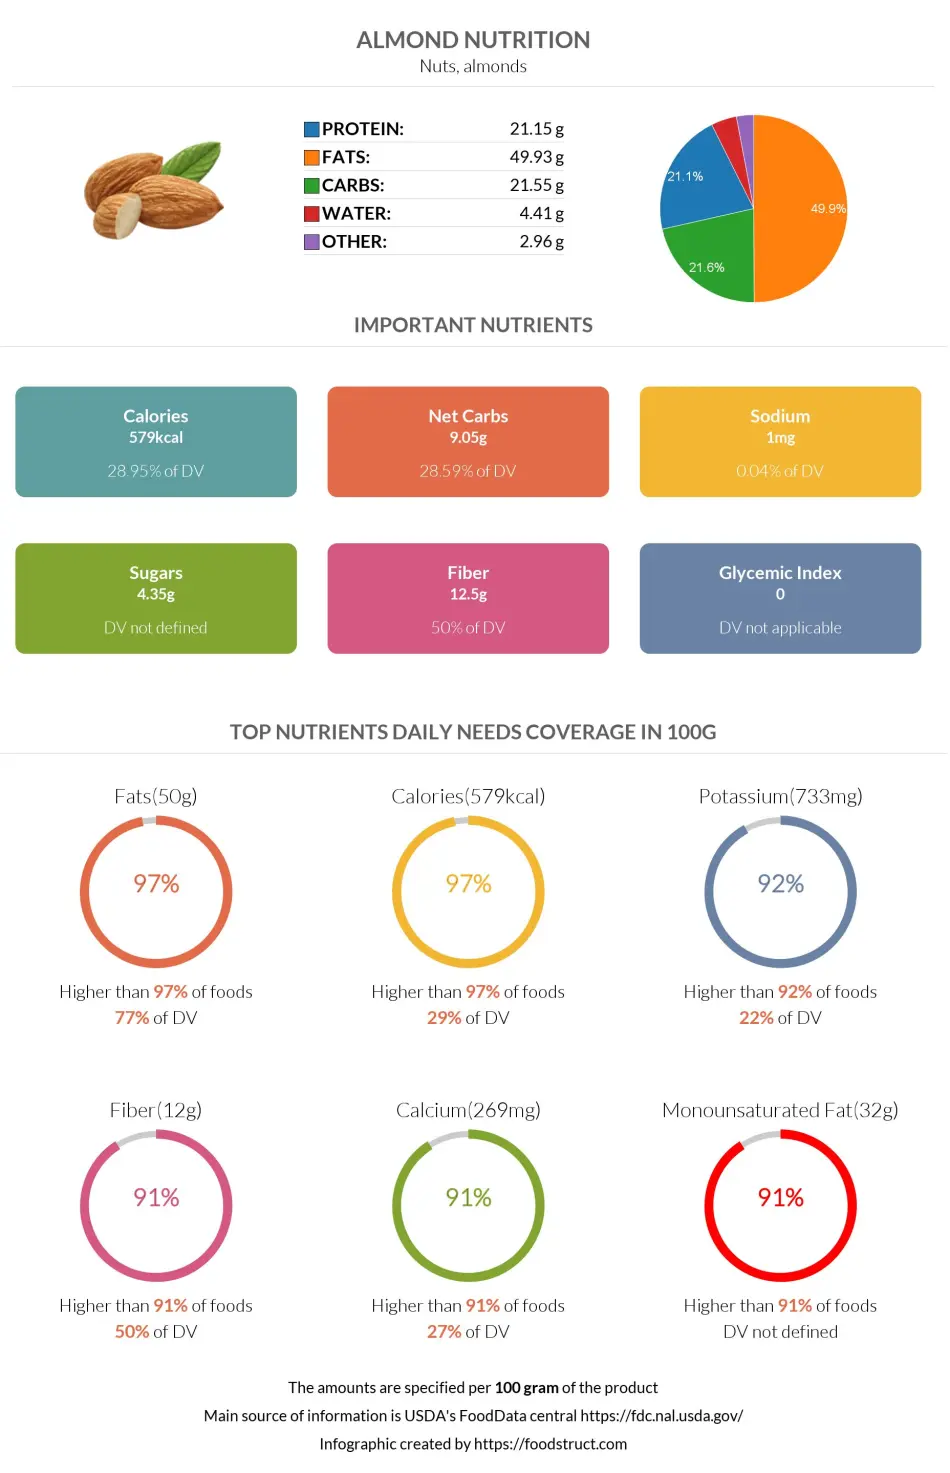
Infographic link
References
All the values for which the sources are not specified explicitly are taken from FDA’s Food Central. The exact link to the food presented on this page can be found below.