Համեմատել Frozen yogurts, flavors other than chocolate և Պերճածաղկի նեկտար սննդամթերքների վիտամինները և միներալները
Համեմատել
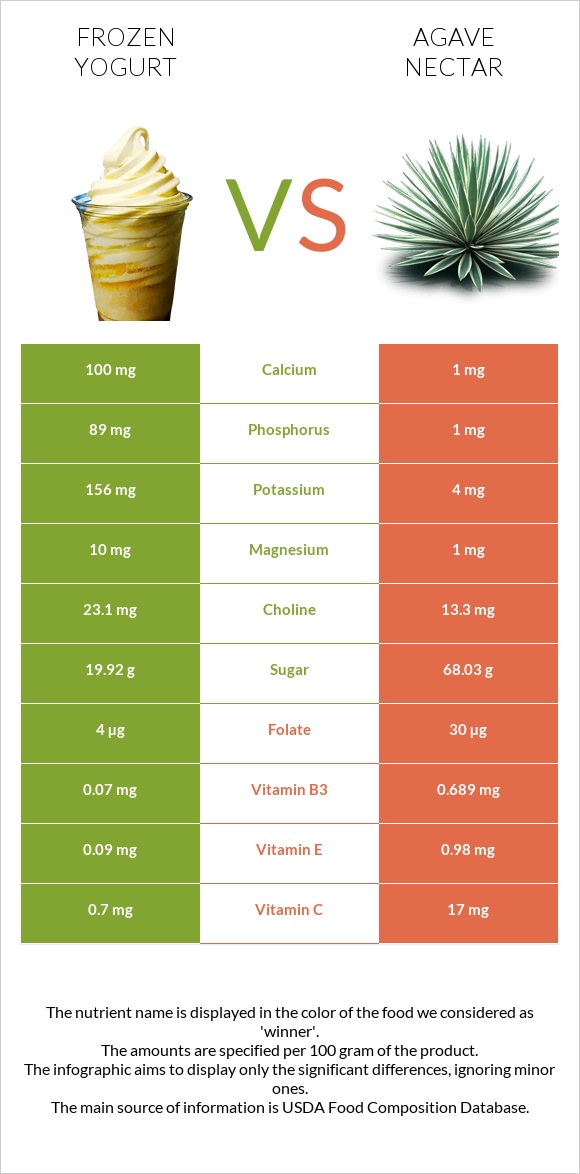
Infographic
Infographic link
Mineral Comparison
Mineral comparison score is based on the number of minerals by which one or the other food is richer. The "coverage" charts below show how much of the daily needs can be covered by 300 grams of the food.
| Պարունակում է ավելի շատ ՄագնեզիումՄագնեզիում | +900% |
| Պարունակում է ավելի շատ ԿալցիումԿալցիում | +9900% |
| Պարունակում է ավելի շատ ԿալիումԿալիում | +3800% |
| Պարունակում է ավելի շատ ԵրկաթԵրկաթ | +411.1% |
| Պարունակում է ավելի շատ ՑինկՑինկ | +2700% |
| Պարունակում է ավելի շատ ՖոսֆորՖոսֆոր | +8800% |
| Պարունակում է ավելի շատ ՍելենՍելեն | +11.8% |
| Պարունակում է ավելի քիչ ՆատրիումՆատրիում | -93.7% |
Vitamin Comparison
Vitamin comparison score is based on the number of vitamins by which one or the other food is richer. The "coverage" charts below show how much of the daily needs can be covered by 300 grams of the food.
| Պարունակում է ավելի շատ Վիտամին AՎիտամին A | +512.5% |
| Պարունակում է ավելի շատ Վիտամին D (D2 + D3)Վիտամին D (D2 + D3) | +∞% |
| Պարունակում է ավելի շատ Վիտամին B12Վիտամին B12 | +∞% |
| Պարունակում է ավելի շատ Choline, totalCholine, total | +73.7% |
| Պարունակում է ավելի շատ Վիտամին CՎիտամին C | +2328.6% |
| Պարունակում է ավելի շատ Վիտամին E Վիտամին E | +988.9% |
| Պարունակում է ավելի շատ Վիտամին B1Վիտամին B1 | +205% |
| Պարունակում է ավելի շատ Վիտամին B3Վիտամին B3 | +884.3% |
| Պարունակում է ավելի շատ Վիտամին B6Վիտամին B6 | +485% |
| Պարունակում է ավելի շատ Վիտամին KՎիտամին K | +7400% |
| Պարունակում է ավելի շատ Folate, totalFolate, total | +650% |
Macronutrient Comparison
Macronutrient breakdown side-by-side comparison
Սպիտակուցներ:
3 գ
Ճարպեր:
3.6 գ
Ածխաջրեր:
21.6 գ
Ջուր:
71.2 գ
Այլ:
0.6 գ
Սպիտակուցներ:
0.09 գ
Ճարպեր:
0.45 գ
Ածխաջրեր:
76.37 գ
Ջուր:
22.94 գ
Այլ:
0.15 գ
| Պարունակում է ավելի շատ ՍպիտակուցներՍպիտակուցներ | +3233.3% |
| Պարունակում է ավելի շատ ՃարպերՃարպեր | +700% |
| Պարունակում է ավելի շատ ՋուրՋուր | +210.4% |
| Պարունակում է ավելի շատ ԱյլԱյլ | +300% |
| Պարունակում է ավելի շատ ԱծխաջրերԱծխաջրեր | +253.6% |
Comparison summary table
Pay attention at the most right column. It shows the amounts side by side, making it easier to realize the amount of difference.
 |
 |
||
| Lower in Խոլեստերին |
|
||
| Lower in Նատրիում |
|
||
| Lower in Հագեցած ճարպ |
|
||
| Lower in Գլիկեմիկ ինդեքս |
|
||
| Lower in Շաքար |
|
||
| Lower in price |
|
||
| Rich in minerals |
|
||
| Rich in vitamins | Equal | ||
All nutrients comparison - raw data values
| Nutrient | |
|
DV% diff. |
| Ֆրուկտոզա | 55.6g | 70% | |
| Վիտամին K | 0.3µg | 22.5µg | 19% |
| Վիտամին C | 0.7mg | 17mg | 18% |
| Ածխաջրեր | 21.6g | 76.37g | 18% |
| Վիտամին B6 | 0.04mg | 0.234mg | 15% |
| Ֆոսֆոր | 89mg | 1mg | 13% |
| Հագեցած ճարպ | 2.326g | 0g | 11% |
| Կալցիում | 100mg | 1mg | 10% |
| Կալորիականություն | 127kcal | 310kcal | 9% |
| Folate, total | 4µg | 30µg | 7% |
| Վիտամին B1 | 0.04mg | 0.122mg | 7% |
| Սպիտակուցներ | 3g | 0.09g | 6% |
| Վիտամին E | 0.09mg | 0.98mg | 6% |
| Երկաթ | 0.46mg | 0.09mg | 5% |
| Ճարպեր | 3.6g | 0.45g | 5% |
| Վիտամին A | 49µg | 8µg | 5% |
| Խոլեստերին | 13mg | 0mg | 4% |
| Վիտամին B3 | 0.07mg | 0.689mg | 4% |
| Կալիում | 156mg | 4mg | 4% |
| Նատրիում | 63mg | 4mg | 3% |
| Վիտամին B12 | 0.07µg | 0µg | 3% |
| Մոնոչհագեցած ճարպ | 0.986g | 0g | 2% |
| Choline, total | 23.1mg | 13.3mg | 2% |
| Մագնեզիում | 10mg | 1mg | 2% |
| Ցինկ | 0.28mg | 0.01mg | 2% |
| Վիտամին B2 | 0.18mg | 0.165mg | 1% |
| Վիտամին D (D2 + D3) | 0.1µg | 0µg | 1% |
| Բջջանյութ(Fiber) | 0g | 0.2g | 1% |
| Պոլիչհագեցած ճարպ | 0.1g | 0g | 1% |
| Զուտ ածխաջրեր | 21.6g | 76.17g | N/A |
| Վիտամին D | 3IU | 0IU | 0% |
| Շաքար | 19.92g | 68.03g | N/A |
| Պղինձ | 0.009mg | 0.009mg | 0% |
| Մանգան | 0.005mg | 0% | |
| Սելեն | 1.9µg | 1.7µg | 0% |
Which food is preferable in case of diets?
is better in case of low diet
|
|
|
| Low Կալորիականություն diet |
|
|
| Low Ճարպեր diet |
|
|
| Low Ածխաջրեր diet |
|
|
| Low glycemic index diet |
|
People also compare


Vitamin and Mineral Summary Scores
Summary score is calculated by summing up the daily values contained in 300 grams of the product. Obviously the more the food fulfils human daily needs, the more the summary score is
Vitamin Summary Score
8%
23%
Mineral Summary Score
14%
2%
Comparison summary
Which food is lower in Խոլեստերին?
Պերճածաղկի նեկտար is lower in Խոլեստերին (difference - 13mg)
Which food is lower in Նատրիում?
Պերճածաղկի նեկտար is lower in Նատրիում (difference - 59mg)
Which food is lower in Հագեցած ճարպ?
Պերճածաղկի նեկտար is lower in Հագեցած ճարպ (difference - 2.326g)
Which food is lower in glycemic index?
Պերճածաղկի նեկտար is lower in glycemic index (difference - 38)
Which food is lower in Շաքար?
Frozen yogurts, flavors other than chocolate is lower in Շաքար (difference - 48.11g)
Which food is cheaper?
Frozen yogurts, flavors other than chocolate is cheaper (difference - $2)
Which food is richer in minerals?
Frozen yogurts, flavors other than chocolate is relatively richer in minerals
Which food is richer in vitamins?
?
It cannot be definitely stated which food is richer in vitamins. See charts below for detailed information.