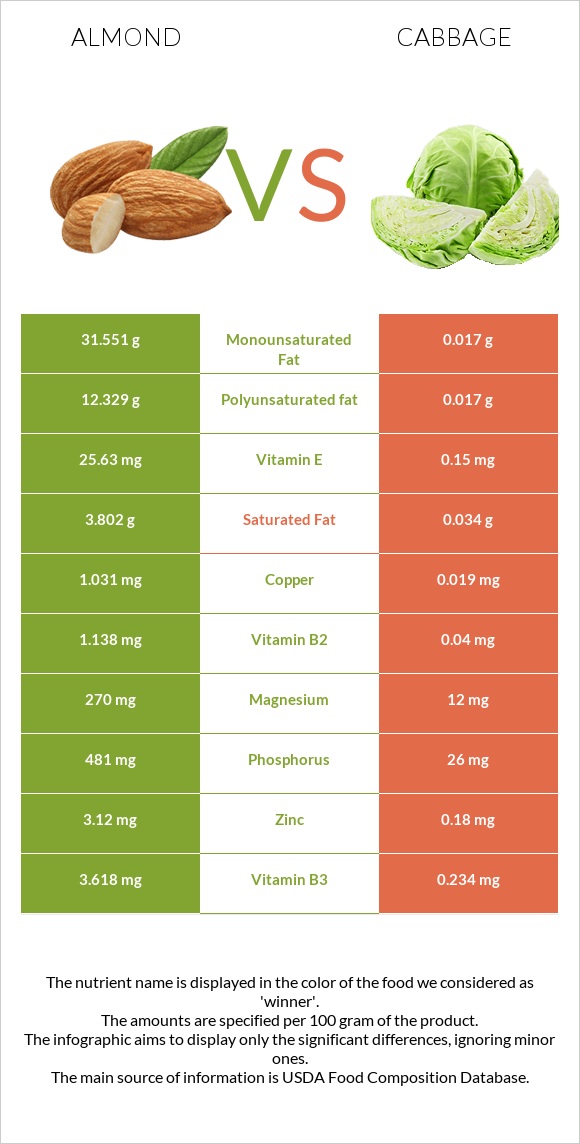
Significant differences between almonds and cabbage Almonds have more vitamin E, copper, manganese, vitamin B2, phosphorus, magnesium, iron, and fiber; however, cabbage is richer in vitamin K and vitamin C. Almonds cover your daily vitamin E needs 170% more than cabbage. Cabbage has 54 times less copper than almonds. Almonds have 1.031mg of copper, while cabbage has 0.019mg. Specific food types used in this comparison are Nuts, almonds and Cabbage, raw .
Infographic
Mineral Comparison
Mineral comparison score is based on the number of minerals by which one or the other food is richer. The "coverage" charts below show how much of the daily needs can be covered by 300 grams of the food.
10
100 g
300 g
1 almond - 1.2g 1 oz (23 whole kernels) - 28.35g 1 cup, sliced - 92g 1 cup, ground - 95g 1 cup, slivered - 108g 1 cup, whole - 143g
Magnesium
Magnesium
Calcium
Calcium
Potassium
Potassium
Iron
Iron
Copper
Copper
Zinc
Zinc
Phosphorus
Phosphorus
Sodium
Sodium
Manganese
Manganese
Selenium
Selenium
193%
81%
65%
139%
344%
85%
206%
0.13%
284%
22%
0
100 g
300 g
1 leaf - 15g 1 leaf, medium - 23g 1 leaf, large - 33g 1 cup, shredded - 70g 1 cup, chopped - 89g 1 head, small (about 4-1/2" dia) - 714g 1 head, medium (about 5-3/4" dia) - 908g 1 head, large (about 7" dia) - 1248g
Magnesium
Magnesium
Calcium
Calcium
Potassium
Potassium
Iron
Iron
Copper
Copper
Zinc
Zinc
Phosphorus
Phosphorus
Sodium
Sodium
Manganese
Manganese
Selenium
Selenium
8.6%
12%
15%
18%
6.3%
4.9%
11%
2.3%
21%
1.6%
Vitamin Comparison
Vitamin comparison score is based on the number of vitamins by which one or the other food is richer. The "coverage" charts below show how much of the daily needs can be covered by 300 grams of the food.
5
100 g
300 g
1 almond - 1.2g 1 oz (23 whole kernels) - 28.35g 1 cup, sliced - 92g 1 cup, ground - 95g 1 cup, slivered - 108g 1 cup, whole - 143g
Vitamin C
Vit. C
Vitamin D
Vit. D
Vitamin A
Vit. A
Vitamin E
Vit. E
Vitamin B1
Vit. B1
Vitamin B2
Vit. B2
Vitamin B3
Vit. B3
Vitamin B5
Vit. B5
Vitamin B6
Vit. B6
Vitamin B12
Vit. B12
Vitamin K
Vit. K
Folate
Folate
0%
0%
0%
513%
51%
263%
68%
28%
32%
0%
0%
33%
3
100 g
300 g
1 leaf - 15g 1 leaf, medium - 23g 1 leaf, large - 33g 1 cup, shredded - 70g 1 cup, chopped - 89g 1 head, small (about 4-1/2" dia) - 714g 1 head, medium (about 5-3/4" dia) - 908g 1 head, large (about 7" dia) - 1248g
Vitamin C
Vit. C
Vitamin D
Vit. D
Vitamin A
Vit. A
Vitamin E
Vit. E
Vitamin B1
Vit. B1
Vitamin B2
Vit. B2
Vitamin B3
Vit. B3
Vitamin B5
Vit. B5
Vitamin B6
Vit. B6
Vitamin B12
Vit. B12
Vitamin K
Vit. K
Folate
Folate
122%
0%
1.7%
3%
15%
9.2%
4.4%
13%
29%
0%
190%
32%
All nutrients comparison - raw data values
Nutrient
DV% diff.
Vitamin E
25.63mg
0.15mg
170%
Copper
1.031mg
0.019mg
112%
Manganese
2.179mg
0.16mg
88%
Vitamin B2
1.138mg
0.04mg
84%
Polyunsaturated fat
12.329g
0.017g
82%
Monounsaturated fat
31.551g
0.017g
79%
Fats
49.93g
0.1g
77%
Phosphorus
481mg
26mg
65%
Vitamin K
0µg
76µg
63%
Magnesium
270mg
12mg
61%
Vitamin C
0mg
36.6mg
41%
Iron
3.71mg
0.47mg
41%
Protein
21.15g
1.28g
40%
Fiber
12.5g
2.5g
40%
Calories
579kcal
25kcal
28%
Zinc
3.12mg
0.18mg
27%
Calcium
269mg
40mg
23%
Vitamin B3
3.618mg
0.234mg
21%
Potassium
733mg
170mg
17%
Saturated fat
3.802g
0.034g
17%
Vitamin B1
0.205mg
0.061mg
12%
Choline
52.1mg
10.7mg
8%
Selenium
4.1µg
0.3µg
7%
Carbs
21.55g
5.8g
5%
Vitamin B5
0.471mg
0.212mg
5%
Fructose
0.11g
1.45g
2%
Sodium
1mg
18mg
1%
Vitamin A
0µg
5µg
1%
Vitamin B6
0.137mg
0.124mg
1%
Protein per 100 calories
3.7g
5.1g
N/A
Calories per 10 g protein
274kcal
195kcal
N/A
Weight per 100 calories
17g
400g
N/A
Unsaturated / Saturated Fat ratio
12
1
N/A
Net carbs
9.05g
3.3g
N/A
Sugar
4.35g
3.2g
N/A
Starch
0.72g
0g
0%
Folate
44µg
43µg
0%
Trans fat
0.015g
0g
N/A
Tryptophan
0.211mg
0.011mg
0%
Threonine
0.601mg
0.035mg
0%
Isoleucine
0.751mg
0.03mg
0%
Leucine
1.473mg
0.041mg
0%
Lysine
0.568mg
0.044mg
0%
Methionine
0.157mg
0.012mg
0%
Phenylalanine
1.132mg
0.032mg
0%
Valine
0.855mg
0.042mg
0%
Histidine
0.539mg
0.022mg
0%
Omega-3 - ALA
0.003g
N/A
Omega-6 - Eicosadienoic acid
0.002g
0g
N/A
Omega-6 - Linoleic acid
12.32g
N/A
Macronutrient Comparison
Macronutrient breakdown side-by-side comparison
4
21%
50%
22%
4%
3%
Protein:
21.15 g
Fats:
49.93 g
Carbs:
21.55 g
Water:
4.41 g
Other:
2.96 g
1
6%
92%
Protein:
1.28 g
Fats:
0.1 g
Carbs:
5.8 g
Water:
92.18 g
Other:
0.64 g
Contains
more
Protein Protein
+1552.3%
Contains
more
Fats Fats
+49830%
Contains
more
Carbs Carbs
+271.6%
Contains
more
Other Other
+362.5%
Contains
more
Water Water
+1990.2%
Fat Type Comparison
Fat type breakdown side-by-side comparison
2
8%
66%
26%
Saturated fat:
Sat. Fat
3.802 g
Monounsaturated fat:
Mono. Fat
31.551 g
Polyunsaturated fat:
Poly. Fat
12.329 g
1
50%
25%
25%
Saturated fat:
Sat. Fat
0.034 g
Monounsaturated fat:
Mono. Fat
0.017 g
Polyunsaturated fat:
Poly. Fat
0.017 g
Contains
more
Mono. Fat Monounsaturated fat
+185494.1%
Contains
more
Poly. Fat Polyunsaturated fat
+72423.5%
Contains
less
Sat. Fat Saturated fat
-99.1%
Carbohydrate type comparison
Carbohydrate type breakdown side-by-side comparison
4
14%
78%
3%
2%
Starch:
0.72 g
Sucrose:
3.95 g
Glucose:
0.17 g
Fructose:
0.11 g
Lactose:
0 g
Maltose:
0.04 g
Galactose:
0.07 g
2
2%
52%
45%
Starch:
0 g
Sucrose:
0.08 g
Glucose:
1.67 g
Fructose:
1.45 g
Lactose:
0 g
Maltose:
0.01 g
Galactose:
0 g
Contains
more
Starch Starch
+∞%
Contains
more
Sucrose Sucrose
+4837.5%
Contains
more
Maltose Maltose
+300%
Contains
more
Galactose Galactose
+∞%
Contains
more
Glucose Glucose
+882.4%
Contains
more
Fructose Fructose
+1218.2%