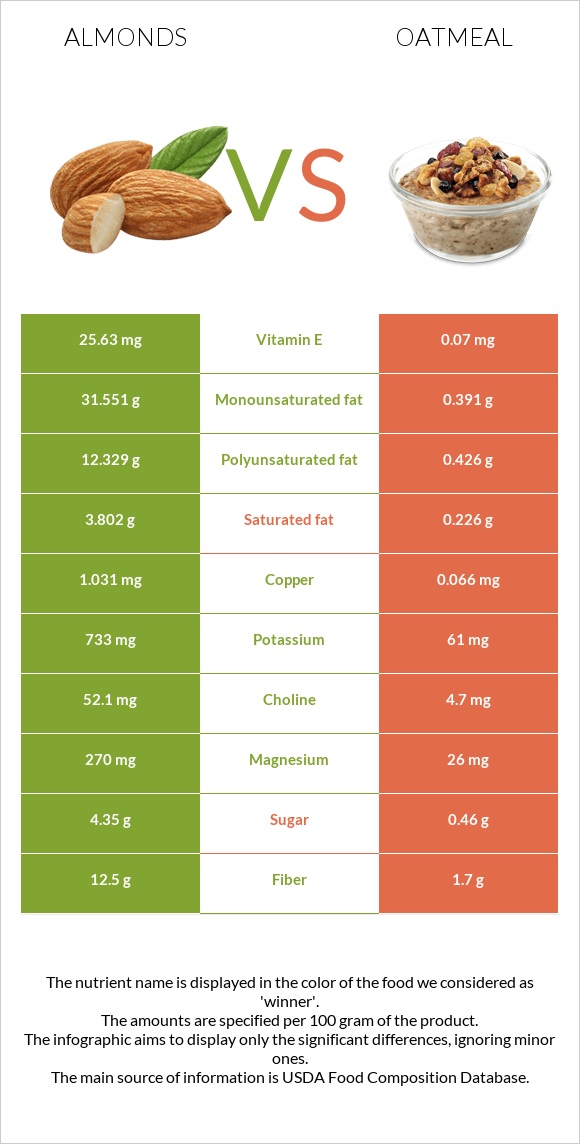
The main differences between almonds and oatmeal Almonds have more vitamin E, copper, vitamin B2, manganese, magnesium, phosphorus, fiber, zinc, and potassium; however, oatmeal has more iron. Daily need coverage for vitamin E for almonds is 170% higher. Oatmeal has 16 times less copper than almonds. Almonds have 1.031mg of copper, while oatmeal has 0.066mg. Oatmeal has a higher glycemic index than almonds. Food types used in this article are Nuts, almonds and Cereals, oats, instant, fortified, plain, prepared with water (boiling water added or microwaved) .
Infographic
Mineral Comparison
Mineral comparison score is based on the number of minerals by which one or the other food is richer. The "coverage" charts below show how much of the daily needs can be covered by 300 grams of the food.
8
100 g
300 g
1 almond - 1.2g 1 oz (23 whole kernels) - 28.35g 1 cup, sliced - 92g 1 cup, ground - 95g 1 cup, slivered - 108g 1 cup, whole - 143g
Magnesium
Magnesium
Calcium
Calcium
Potassium
Potassium
Iron
Iron
Copper
Copper
Zinc
Zinc
Phosphorus
Phosphorus
Sodium
Sodium
Manganese
Manganese
Selenium
Selenium
193%
81%
65%
139%
344%
85%
206%
0.13%
284%
22%
2
100 g
300 g
1 oz, dry, yields - 177g 1 packet, dry, yields - 177g 1 cup, cooked - 234g 1 cup, dry, yields - 501g
Magnesium
Magnesium
Calcium
Calcium
Potassium
Potassium
Iron
Iron
Copper
Copper
Zinc
Zinc
Phosphorus
Phosphorus
Sodium
Sodium
Manganese
Manganese
Selenium
Selenium
19%
24%
5.4%
224%
22%
17%
33%
6.4%
73%
27%
Vitamin Comparison
Vitamin comparison score is based on the number of vitamins by which one or the other food is richer. The "coverage" charts below show how much of the daily needs can be covered by 300 grams of the food.
4
100 g
300 g
1 almond - 1.2g 1 oz (23 whole kernels) - 28.35g 1 cup, sliced - 92g 1 cup, ground - 95g 1 cup, slivered - 108g 1 cup, whole - 143g
Vitamin C
Vit. C
Vitamin D
Vit. D
Vitamin A
Vit. A
Vitamin E
Vit. E
Vitamin B1
Vit. B1
Vitamin B2
Vit. B2
Vitamin B3
Vit. B3
Vitamin B5
Vit. B5
Vitamin B6
Vit. B6
Vitamin B12
Vit. B12
Vitamin K
Vit. K
Folate
Folate
0%
0%
0%
513%
51%
263%
68%
28%
32%
0%
0%
33%
4
100 g
300 g
1 oz, dry, yields - 177g 1 packet, dry, yields - 177g 1 cup, cooked - 234g 1 cup, dry, yields - 501g
Vitamin C
Vit. C
Vitamin D
Vit. D
Vitamin A
Vit. A
Vitamin E
Vit. E
Vitamin B1
Vit. B1
Vitamin B2
Vit. B2
Vitamin B3
Vit. B3
Vitamin B5
Vit. B5
Vitamin B6
Vit. B6
Vitamin B12
Vit. B12
Vitamin K
Vit. K
Folate
Folate
0%
0%
43%
1.4%
65%
50%
57%
19%
67%
0%
1%
33%
All nutrients comparison - raw data values
Nutrient
DV% diff.
Vitamin E
25.63mg
0.07mg
170%
Copper
1.031mg
0.066mg
107%
Polyunsaturated fat
12.329g
0.426g
79%
Monounsaturated fat
31.551g
0.391g
78%
Fats
49.93g
1.36g
75%
Vitamin B2
1.138mg
0.215mg
71%
Manganese
2.179mg
0.558mg
70%
Magnesium
270mg
26mg
58%
Phosphorus
481mg
77mg
58%
Fiber
12.5g
1.7g
43%
Protein
21.15g
2.37g
38%
Iron
3.71mg
5.96mg
28%
Calories
579kcal
68kcal
26%
Zinc
3.12mg
0.62mg
23%
Potassium
733mg
61mg
20%
Calcium
269mg
80mg
19%
Saturated fat
3.802g
0.226g
16%
Vitamin A
0µg
130µg
14%
Vitamin B6
0.137mg
0.29mg
12%
Choline
52.1mg
4.7mg
9%
Vitamin B1
0.205mg
0.26mg
5%
Starch
0.72g
10.37g
4%
Vitamin B3
3.618mg
3.025mg
4%
Carbs
21.55g
11.67g
3%
Vitamin B5
0.471mg
0.317mg
3%
Sodium
1mg
49mg
2%
Selenium
4.1µg
5µg
2%
Protein per 100 calories
3.7g
3.5g
N/A
Calories per 10 g protein
274kcal
287kcal
N/A
Weight per 100 calories
17g
147g
N/A
Unsaturated / Saturated Fat ratio
12
3.6
N/A
Net carbs
9.05g
9.97g
N/A
Sugar
4.35g
0.46g
N/A
Vitamin K
0µg
0.4µg
0%
Folate
44µg
44µg
0%
Trans fat
0.015g
0.003g
N/A
Tryptophan
0.211mg
0.04mg
0%
Threonine
0.601mg
0.083mg
0%
Isoleucine
0.751mg
0.105mg
0%
Leucine
1.473mg
0.2mg
0%
Lysine
0.568mg
0.135mg
0%
Methionine
0.157mg
0.04mg
0%
Phenylalanine
1.132mg
0.13mg
0%
Valine
0.855mg
0.151mg
0%
Histidine
0.539mg
0.057mg
0%
Fructose
0.11g
0g
0%
Omega-3 - ALA
0.003g
N/A
Omega-6 - Eicosadienoic acid
0.002g
N/A
Omega-6 - Linoleic acid
12.32g
N/A
Macronutrient Comparison
Macronutrient breakdown side-by-side comparison
4
21%
50%
22%
4%
3%
Protein:
21.15 g
Fats:
49.93 g
Carbs:
21.55 g
Water:
4.41 g
Other:
2.96 g
1
2%
12%
84%
Protein:
2.37 g
Fats:
1.36 g
Carbs:
11.67 g
Water:
84.03 g
Other:
0.57 g
Contains
more
Protein Protein
+792.4%
Contains
more
Fats Fats
+3571.3%
Contains
more
Carbs Carbs
+84.7%
Contains
more
Other Other
+419.3%
Contains
more
Water Water
+1805.4%
Fat Type Comparison
Fat type breakdown side-by-side comparison
2
8%
66%
26%
Saturated fat:
Sat. Fat
3.802 g
Monounsaturated fat:
Mono. Fat
31.551 g
Polyunsaturated fat:
Poly. Fat
12.329 g
1
22%
37%
41%
Saturated fat:
Sat. Fat
0.226 g
Monounsaturated fat:
Mono. Fat
0.391 g
Polyunsaturated fat:
Poly. Fat
0.426 g
Contains
more
Mono. Fat Monounsaturated fat
+7969.3%
Contains
more
Poly. Fat Polyunsaturated fat
+2794.1%
Contains
less
Sat. Fat Saturated fat
-94.1%
Carbohydrate type comparison
Carbohydrate type breakdown side-by-side comparison
4
14%
78%
3%
2%
Starch:
0.72 g
Sucrose:
3.95 g
Glucose:
0.17 g
Fructose:
0.11 g
Lactose:
0 g
Maltose:
0.04 g
Galactose:
0.07 g
2
96%
3%
Starch:
10.37 g
Sucrose:
0.29 g
Glucose:
0 g
Fructose:
0 g
Lactose:
0 g
Maltose:
0 g
Galactose:
0.16 g
Contains
more
Sucrose Sucrose
+1262.1%
Contains
more
Glucose Glucose
+∞%
Contains
more
Fructose Fructose
+∞%
Contains
more
Maltose Maltose
+∞%
Contains
more
Starch Starch
+1340.3%
Contains
more
Galactose Galactose
+128.6%