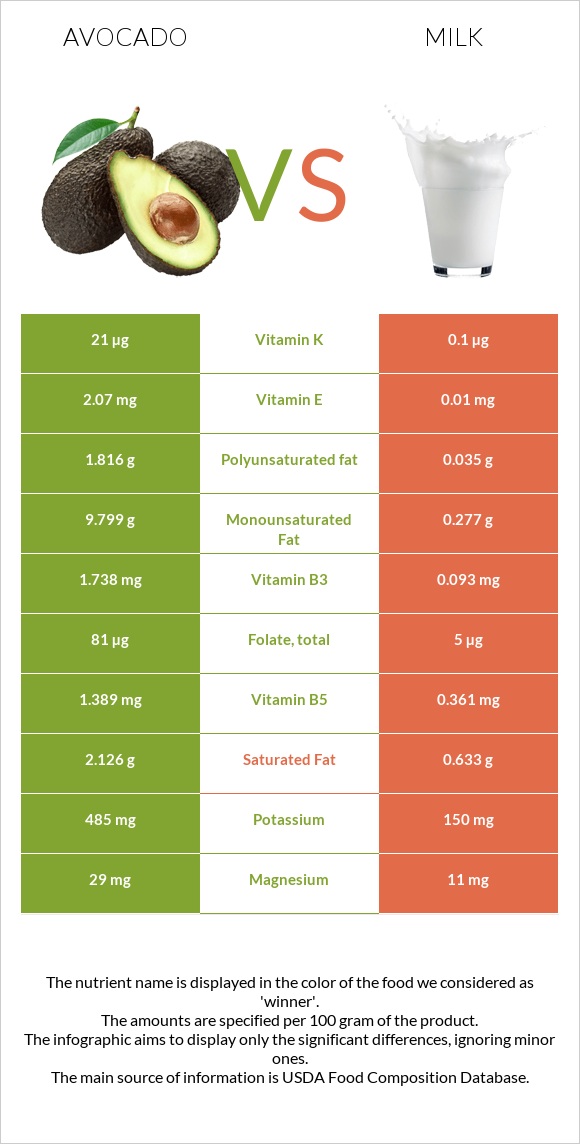
How are avocados and milk different? Avocados are higher in fiber, vitamin B5, copper, folate, vitamin K, vitamin B6, vitamin E, and vitamin C; however, milk is richer in vitamin B12 and calcium. Daily need coverage for fiber for avocados is 27% higher. Avocados, raw, all commercial varieties and Milk, lowfat, fluid, 1% milkfat, with added vitamin A and vitamin D are the varieties used in this article.
Infographic
Mineral Comparison
Mineral comparison score is based on the number of minerals by which one or the other food is richer. The "coverage" charts below show how much of the daily needs can be covered by 300 grams of the food.
7
100 g
300 g
1 cup, sliced - 146g 1 cup, cubes - 150g 1 avocado, NS as to Florida or California - 201g 1 cup, pureed - 230g
Magnesium
Magnesium
Calcium
Calcium
Potassium
Potassium
Iron
Iron
Copper
Copper
Zinc
Zinc
Phosphorus
Phosphorus
Sodium
Sodium
Manganese
Manganese
Selenium
Selenium
21%
3.6%
43%
21%
63%
17%
22%
0.91%
19%
2.2%
3
100 g
300 g
1 fl oz - 30.5g 1 cup - 244g 1 quart - 976g
Magnesium
Magnesium
Calcium
Calcium
Potassium
Potassium
Iron
Iron
Copper
Copper
Zinc
Zinc
Phosphorus
Phosphorus
Sodium
Sodium
Manganese
Manganese
Selenium
Selenium
7.9%
38%
13%
1.1%
3.3%
11%
41%
5.7%
0.39%
18%
Vitamin Comparison
Vitamin comparison score is based on the number of vitamins by which one or the other food is richer. The "coverage" charts below show how much of the daily needs can be covered by 300 grams of the food.
8
100 g
300 g
1 cup, sliced - 146g 1 cup, cubes - 150g 1 avocado, NS as to Florida or California - 201g 1 cup, pureed - 230g
Vitamin C
Vit. C
Vitamin D
Vit. D
Vitamin A
Vit. A
Vitamin E
Vit. E
Vitamin B1
Vit. B1
Vitamin B2
Vit. B2
Vitamin B3
Vit. B3
Vitamin B5
Vit. B5
Vitamin B6
Vit. B6
Vitamin B12
Vit. B12
Vitamin K
Vit. K
Folate
Folate
33%
0%
2.3%
41%
17%
30%
33%
83%
59%
0%
53%
61%
4
100 g
300 g
1 fl oz - 30.5g 1 cup - 244g 1 quart - 976g
Vitamin C
Vit. C
Vitamin D
Vit. D
Vitamin A
Vit. A
Vitamin E
Vit. E
Vitamin B1
Vit. B1
Vitamin B2
Vit. B2
Vitamin B3
Vit. B3
Vitamin B5
Vit. B5
Vitamin B6
Vit. B6
Vitamin B12
Vit. B12
Vitamin K
Vit. K
Folate
Folate
0%
18%
19%
0.2%
5%
43%
1.7%
22%
8.5%
59%
0.25%
3.8%
All nutrients comparison - raw data values
Nutrient
DV% diff.
Fiber
6.7g
0g
27%
Monounsaturated fat
9.799g
0.277g
24%
Fats
14.66g
0.97g
21%
Vitamin B5
1.389mg
0.361mg
21%
Copper
0.19mg
0.01mg
20%
Vitamin B12
0µg
0.47µg
20%
Folate
81µg
5µg
19%
Vitamin B6
0.257mg
0.037mg
17%
Vitamin K
21µg
0.1µg
17%
Vitamin E
2.07mg
0.01mg
14%
Polyunsaturated fat
1.816g
0.035g
12%
Vitamin C
10mg
0mg
11%
Calcium
12mg
125mg
11%
Potassium
485mg
150mg
10%
Vitamin B3
1.738mg
0.093mg
10%
Iron
0.55mg
0.03mg
7%
Saturated fat
2.126g
0.633g
7%
Calories
160kcal
42kcal
6%
Vitamin D*
0 IU
48 IU
6%
Vitamin D
0µg
1.2µg
6%
Phosphorus
52mg
95mg
6%
Vitamin A
7µg
58µg
6%
Manganese
0.142mg
0.003mg
6%
Selenium
0.4µg
3.3µg
5%
Magnesium
29mg
11mg
4%
Vitamin B1
0.067mg
0.02mg
4%
Vitamin B2
0.13mg
0.185mg
4%
Protein
2g
3.37g
3%
Cholesterol
0mg
5mg
2%
Zinc
0.64mg
0.42mg
2%
Sodium
7mg
44mg
2%
Carbs
8.53g
4.99g
1%
Choline
14.2mg
17.7mg
1%
Protein per 100 calories
1.3g
8g
N/A
Calories per 10 g protein
800kcal
125kcal
N/A
Weight per 100 calories
63g
238g
N/A
Unsaturated / Saturated Fat ratio
5.5
0.49
N/A
Net carbs
1.83g
4.99g
N/A
Sugar
0.66g
5.2g
N/A
Starch
0.11g
0%
Tryptophan
0.025mg
0.043mg
0%
Threonine
0.073mg
0.143mg
0%
Isoleucine
0.084mg
0.174mg
0%
Leucine
0.143mg
0.319mg
0%
Lysine
0.132mg
0.282mg
0%
Methionine
0.038mg
0.088mg
0%
Phenylalanine
0.097mg
0.174mg
0%
Valine
0.107mg
0.22mg
0%
Histidine
0.049mg
0.101mg
0%
Fructose
0.12g
0g
0%
Omega-3 - ALA
0.111g
0.004g
N/A
Omega-6 - Gamma-linoleic acid
0.015g
N/A
Omega-6 - Linoleic acid
0.027g
N/A
Macronutrient Comparison
Macronutrient breakdown side-by-side comparison
3
2%
15%
9%
73%
Protein:
2 g
Fats:
14.66 g
Carbs:
8.53 g
Water:
73.23 g
Other:
1.58 g
2
3%
5%
90%
Protein:
3.37 g
Fats:
0.97 g
Carbs:
4.99 g
Water:
89.92 g
Other:
0.75 g
Contains
more
Fats Fats
+1411.3%
Contains
more
Carbs Carbs
+70.9%
Contains
more
Other Other
+110.7%
Contains
more
Protein Protein
+68.5%
Contains
more
Water Water
+22.8%
Fat Type Comparison
Fat type breakdown side-by-side comparison
2
15%
71%
13%
Saturated fat:
Sat. Fat
2.126 g
Monounsaturated fat:
Mono. Fat
9.799 g
Polyunsaturated fat:
Poly. Fat
1.816 g
1
67%
29%
4%
Saturated fat:
Sat. Fat
0.633 g
Monounsaturated fat:
Mono. Fat
0.277 g
Polyunsaturated fat:
Poly. Fat
0.035 g
Contains
more
Mono. Fat Monounsaturated fat
+3437.5%
Contains
more
Poly. Fat Polyunsaturated fat
+5088.6%
Contains
less
Sat. Fat Saturated fat
-70.2%
Carbohydrate type comparison
Carbohydrate type breakdown side-by-side comparison
5
14%
8%
49%
16%
13%
Starch:
0.11 g
Sucrose:
0.06 g
Glucose:
0.37 g
Fructose:
0.12 g
Lactose:
0 g
Maltose:
0 g
Galactose:
0.1 g
1
100%
Starch:
0 g
Sucrose:
0 g
Glucose:
0 g
Fructose:
0 g
Lactose:
5.2 g
Maltose:
0 g
Galactose:
0 g
Contains
more
Starch Starch
+∞%
Contains
more
Sucrose Sucrose
+∞%
Contains
more
Glucose Glucose
+∞%
Contains
more
Fructose Fructose
+∞%
Contains
more
Galactose Galactose
+∞%
Contains
more
Lactose Lactose
+∞%