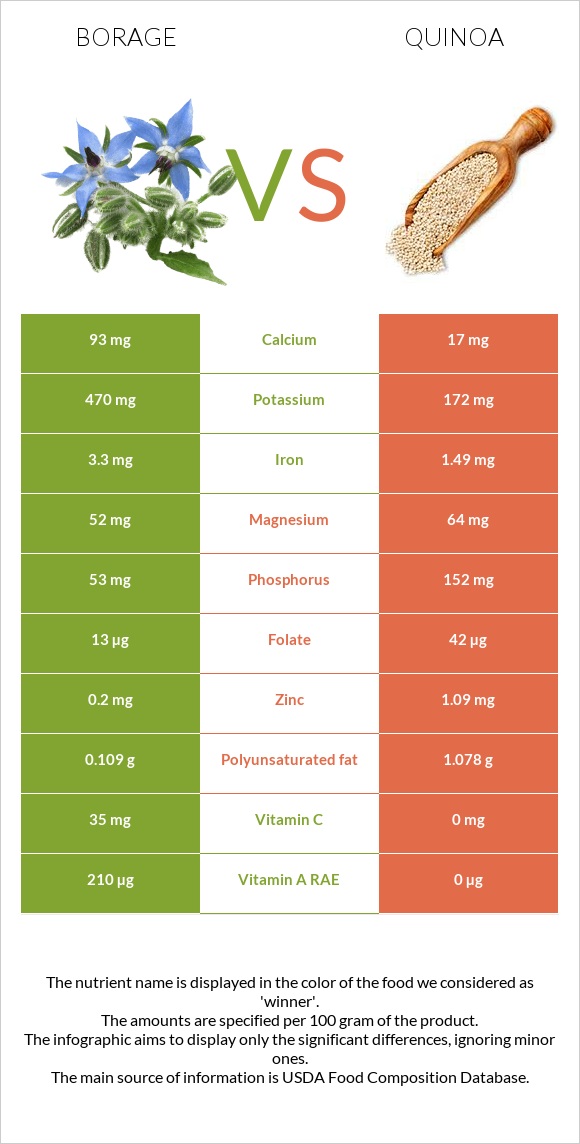
Significant differences between borage and quinoa Borage has more vitamin A, vitamin C, iron, potassium, and calcium; however, quinoa is richer in phosphorus, manganese, zinc, folate, and copper. Borage covers your daily vitamin A needs 84% more than quinoa. Specific food types used in this comparison are Borage, raw and Quinoa, cooked .
Infographic
Mineral Comparison
Mineral comparison score is based on the number of minerals by which one or the other food is richer. The "coverage" charts below show how much of the daily needs can be covered by 300 grams of the food.
3
100 g
300 g
1 cup (1" pieces) - 89g
Magnesium
Magnesium
Calcium
Calcium
Potassium
Potassium
Iron
Iron
Copper
Copper
Zinc
Zinc
Phosphorus
Phosphorus
Sodium
Sodium
Manganese
Manganese
Selenium
Selenium
37%
28%
41%
124%
43%
5.5%
23%
10%
46%
4.9%
7
100 g
300 g
1 cup - 185g
Magnesium
Magnesium
Calcium
Calcium
Potassium
Potassium
Iron
Iron
Copper
Copper
Zinc
Zinc
Phosphorus
Phosphorus
Sodium
Sodium
Manganese
Manganese
Selenium
Selenium
46%
5.1%
15%
56%
64%
30%
65%
0.91%
82%
15%
Vitamin Comparison
Vitamin comparison score is based on the number of vitamins by which one or the other food is richer. The "coverage" charts below show how much of the daily needs can be covered by 300 grams of the food.
5
100 g
300 g
1 cup (1" pieces) - 89g
Vitamin C
Vit. C
Vitamin D
Vit. D
Vitamin A
Vit. A
Vitamin E
Vit. E
Vitamin B1
Vit. B1
Vitamin B2
Vit. B2
Vitamin B3
Vit. B3
Vitamin B5
Vit. B5
Vitamin B6
Vit. B6
Vitamin B12
Vit. B12
Vitamin K
Vit. K
Folate
Folate
117%
0%
70%
0%
15%
35%
17%
2.5%
19%
0%
0%
9.8%
4
100 g
300 g
1 cup - 185g
Vitamin C
Vit. C
Vitamin D
Vit. D
Vitamin A
Vit. A
Vitamin E
Vit. E
Vitamin B1
Vit. B1
Vitamin B2
Vit. B2
Vitamin B3
Vit. B3
Vitamin B5
Vit. B5
Vitamin B6
Vit. B6
Vitamin B12
Vit. B12
Vitamin K
Vit. K
Folate
Folate
0%
0%
0%
13%
27%
25%
7.7%
0%
28%
0%
0%
32%
All nutrients comparison - raw data values
Nutrient
DV% diff.
Vitamin C
35mg
0mg
39%
Iron
3.3mg
1.49mg
23%
Vitamin A
210µg
0µg
23%
Phosphorus
53mg
152mg
14%
Manganese
0.349mg
0.631mg
12%
Fiber
2.8g
11%
Potassium
470mg
172mg
9%
Calcium
93mg
17mg
8%
Zinc
0.2mg
1.09mg
8%
Copper
0.13mg
0.192mg
7%
Starch
17.63g
7%
Folate
13µg
42µg
7%
Carbs
3.06g
21.3g
6%
Polyunsaturated fat
0.109g
1.078g
6%
Calories
21kcal
120kcal
5%
Protein
1.8g
4.4g
5%
Vitamin E
0.63mg
4%
Vitamin B1
0.06mg
0.107mg
4%
Choline
23mg
4%
Magnesium
52mg
64mg
3%
Sodium
80mg
7mg
3%
Selenium
0.9µg
2.8µg
3%
Vitamin B2
0.15mg
0.11mg
3%
Vitamin B3
0.9mg
0.412mg
3%
Vitamin B6
0.084mg
0.123mg
3%
Fats
0.7g
1.92g
2%
Vitamin B5
0.041mg
1%
Monounsaturated fat
0.211g
0.528g
1%
Protein per 100 calories
8.6g
3.7g
N/A
Calories per 10 g protein
117kcal
273kcal
N/A
Weight per 100 calories
476g
83g
N/A
Net carbs
3.06g
18.5g
N/A
Sugar
0.87g
N/A
Saturated fat
0.17g
0.231g
0%
Tryptophan
0.052mg
0%
Threonine
0.131mg
0%
Isoleucine
0.157mg
0%
Leucine
0.261mg
0%
Lysine
0.239mg
0%
Methionine
0.096mg
0%
Phenylalanine
0.185mg
0%
Valine
0.185mg
0%
Histidine
0.127mg
0%
Omega-3 - DHA
0.015g
N/A
Macronutrient Comparison
Macronutrient breakdown side-by-side comparison
2
2%
3%
93%
Protein:
1.8 g
Fats:
0.7 g
Carbs:
3.06 g
Water:
93 g
Other:
1.44 g
3
4%
2%
21%
72%
Protein:
4.4 g
Fats:
1.92 g
Carbs:
21.3 g
Water:
71.61 g
Other:
0.77 g
Contains
more
Water Water
+29.9%
Contains
more
Other Other
+87%
Contains
more
Protein Protein
+144.4%
Contains
more
Fats Fats
+174.3%
Contains
more
Carbs Carbs
+596.1%
Fat Type Comparison
Fat type breakdown side-by-side comparison
1
35%
43%
22%
Saturated fat:
Sat. Fat
0.17 g
Monounsaturated fat:
Mono. Fat
0.211 g
Polyunsaturated fat:
Poly. Fat
0.109 g
2
13%
29%
59%
Saturated fat:
Sat. Fat
0.231 g
Monounsaturated fat:
Mono. Fat
0.528 g
Polyunsaturated fat:
Poly. Fat
1.078 g
Contains
less
Sat. Fat Saturated fat
-26.4%
Contains
more
Mono. Fat Monounsaturated fat
+150.2%
Contains
more
Poly. Fat Polyunsaturated fat
+889%