Quinoa nutrition: calories, carbs, GI, protein, fiber, fats
Carbs in quinoa
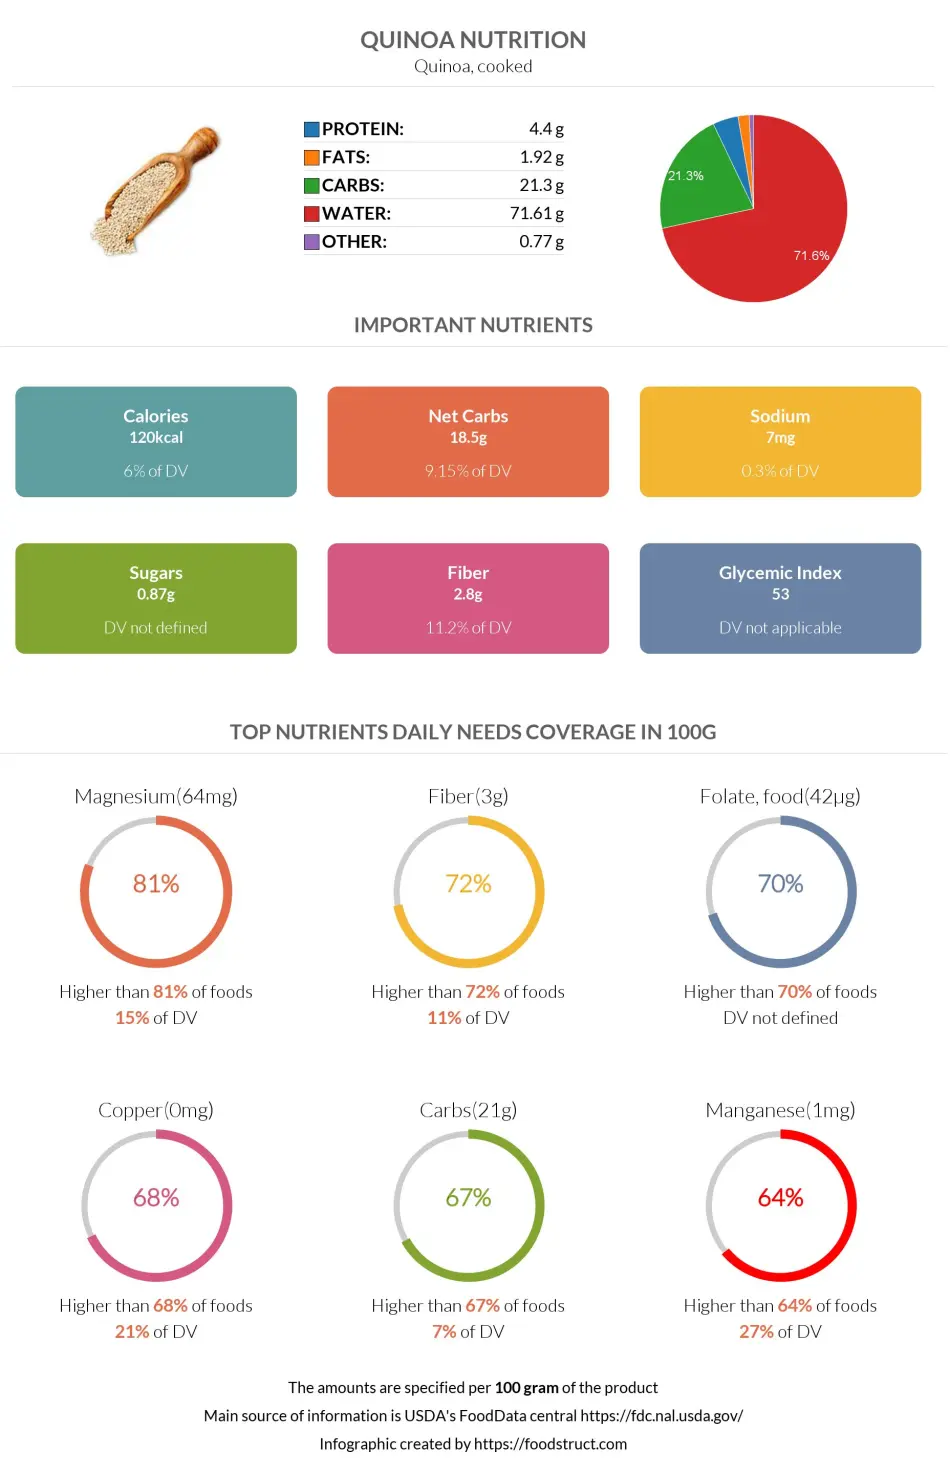
Cooked quinoa contains 72% water and 28% macronutrients. Most of the macronutrients in quinoa are carbs. One hundred grams of quinoa contains 21.3g of carbs, which covers 7% of the daily need (in the case of a 2000-calorie diet).
To cover the daily carb need, a person must consume 1.4kg of quinoa.
Macronutrients chart
What Do 124 Calories or 100 Grams of Quinoa Look Like?
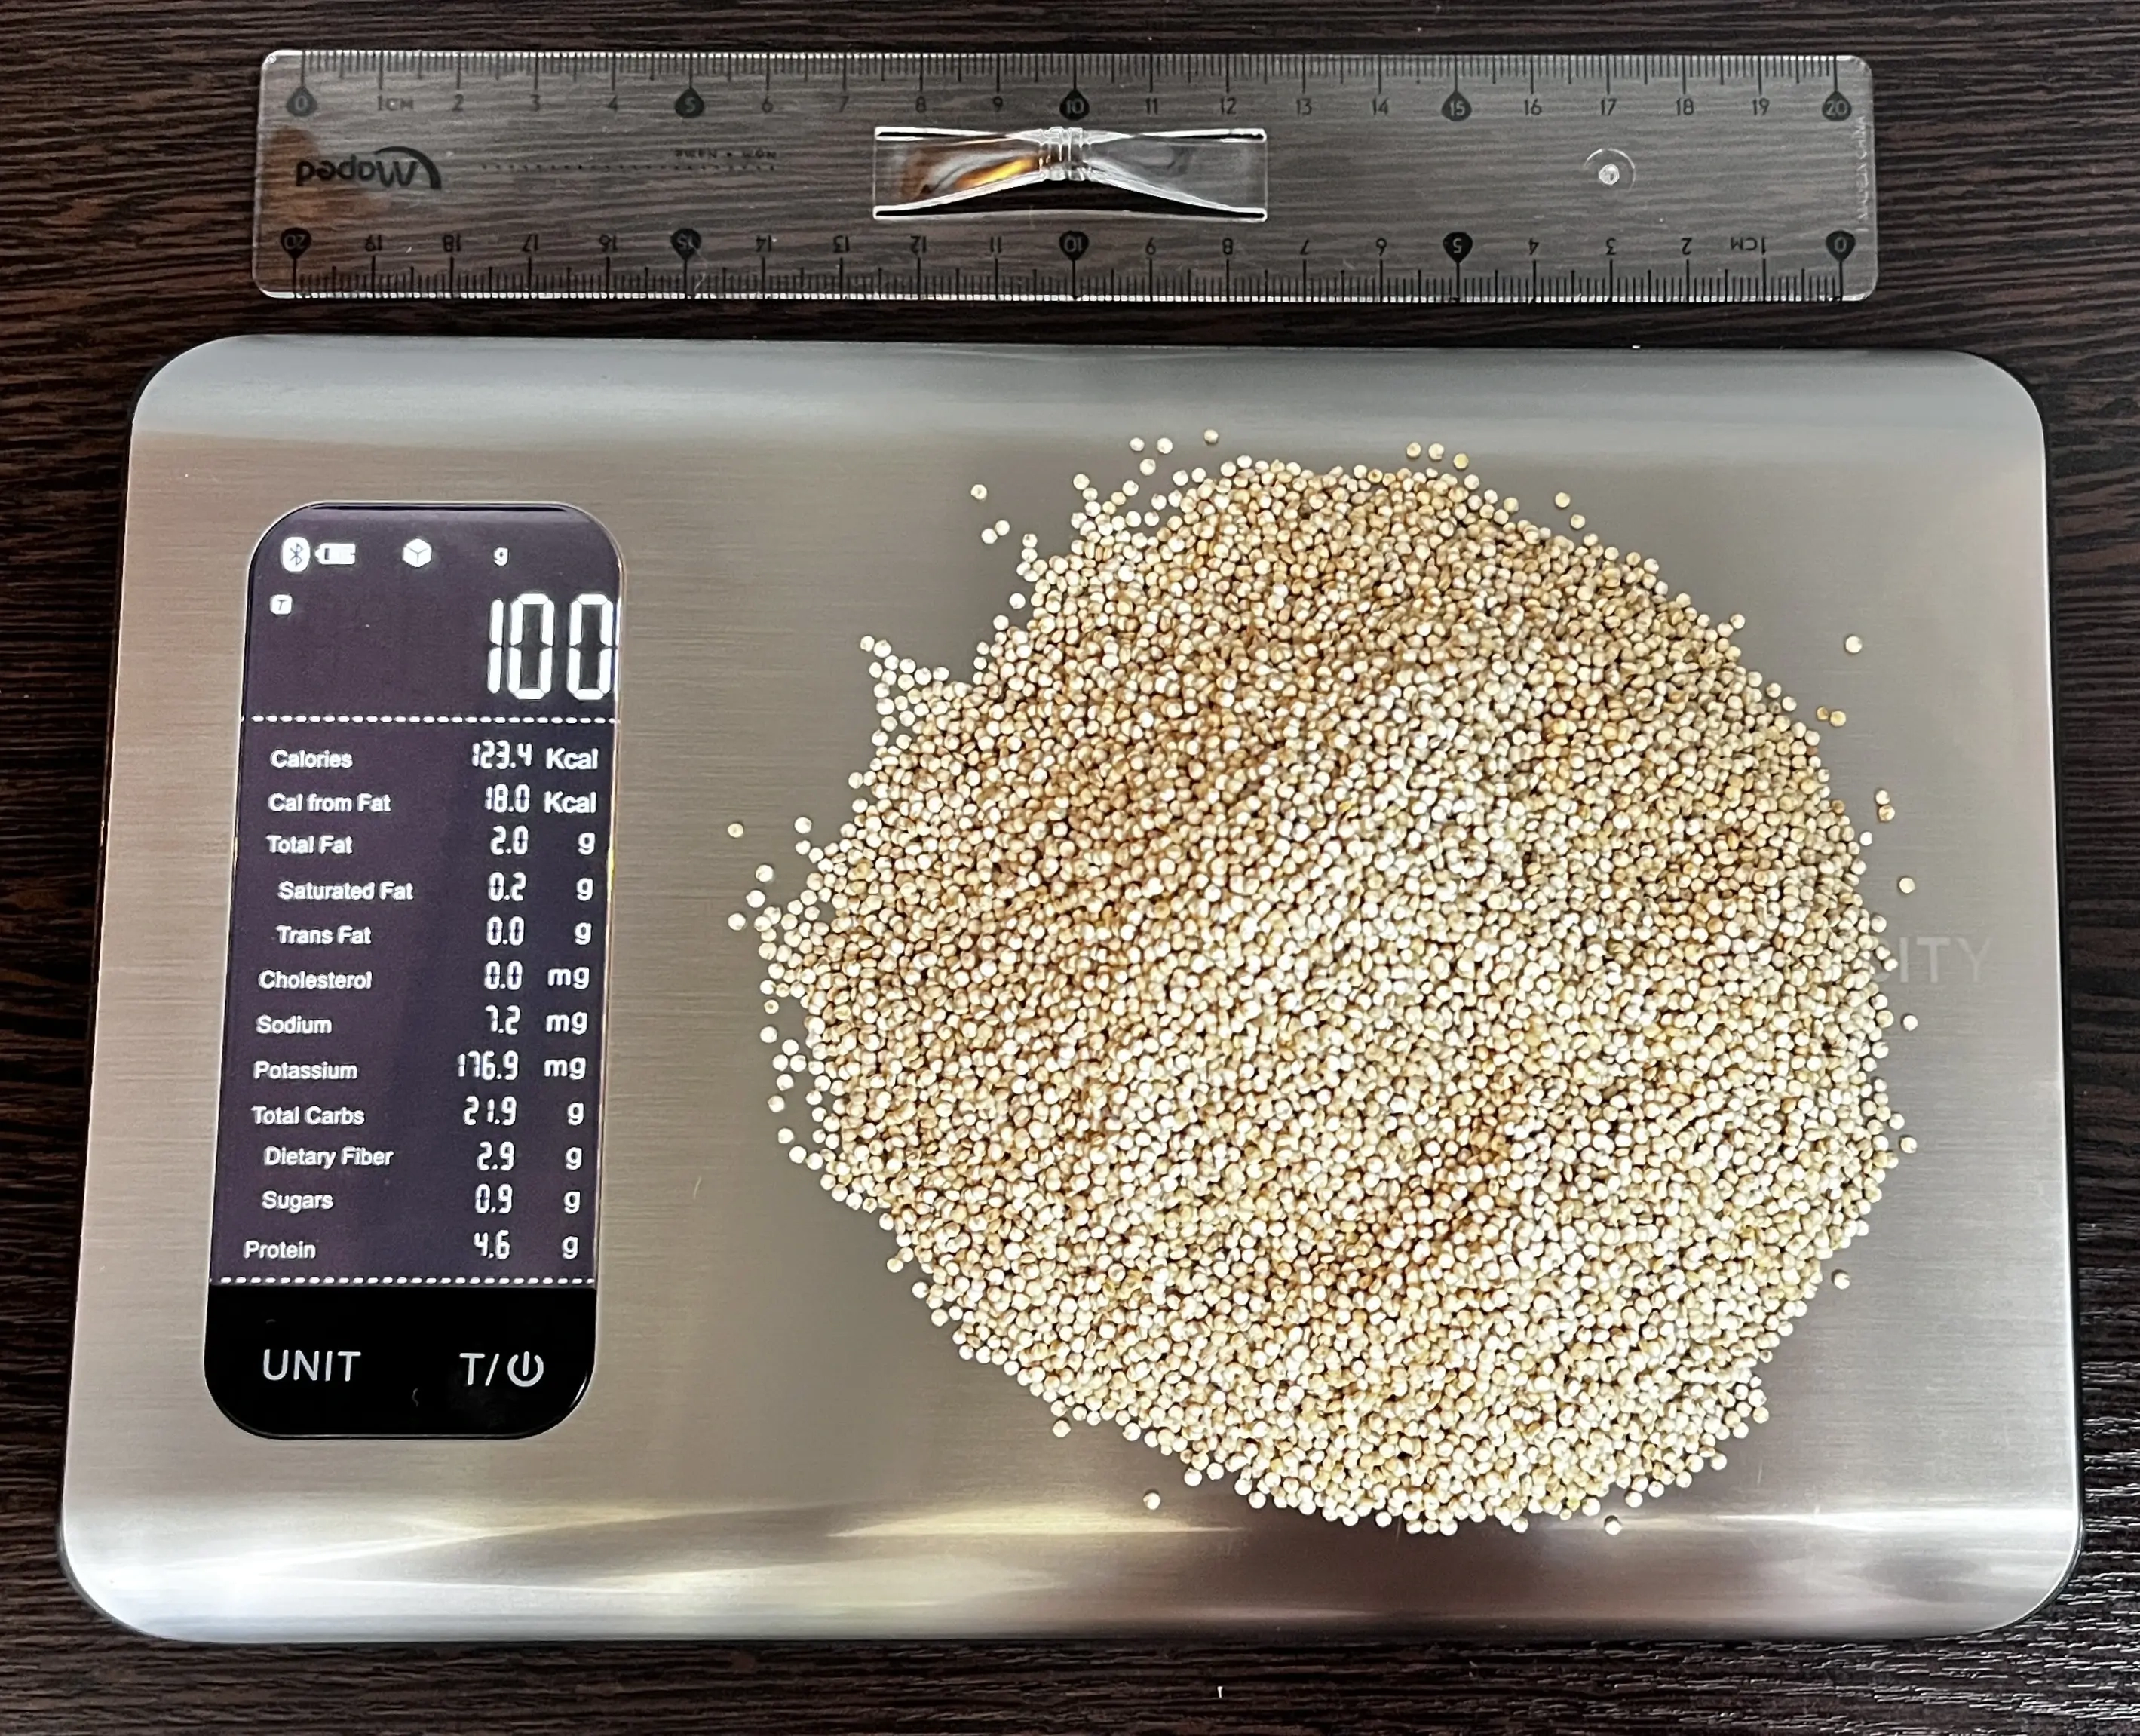
The picture above shows what 124 calories or 100 grams of quinoa look like, giving a visual reference for their weight and energy content. A typical serving size is 1 cup (185 g) of cooked quinoa, which provides 230 calories. Keep in mind that calorie content may vary depending on the variety and cooking method.
Carbs per serving size
The average serving size of quinoa is 185 grams (one cup), containing 39.4g of carbs.
Different types
Raw or uncooked quinoa has three times more carbs compared to cooked quinoa.
Not only is uncooked quinoa high in carbs, but it is also not recommended due to being high in anti-nutrients.
Carbohydrate type breakdown
The chart below shows that all carbs that break down to simple sugars are starch.
Carbohydrate type breakdown
Quinoa net carbs
As previously mentioned, 100g of quinoa contains 21.3g of carbs: 18.5 net carbs and 2.8g of dietary fiber. As quinoa is high in net carbs, it is not the best choice for low-carb diets such as Keto.
Quinoa is often compared to rice. Calculations have shown that white rice contains 1.5 times more net carbs and less dietary fiber than quinoa. To know more about their differences, you can visit this page.
Soluble or insoluble fiber
Most of the fiber found in quinoa is insoluble. According to one study, 78% of quinoa’s dietary fiber is insoluble, whereas, in another one, 88-90% of the fiber is insoluble (1, 2).
Fiber content ratio for Quinoa
References

Top nutrition facts for Quinoa
| Calories ⓘ Calories for selected serving | 120 kcal |
|
Glycemic index ⓘ
Source:
Check out our Glycemic index chart page for the full list.
|
53 (low) |
| Glycemic load ⓘ Glycemic Load (GL) is a metric that measures both the quality (Glycemic Index) and quantity of carbohydrates in a specific serving of food to estimate its impact on blood sugar levels. It is calculated as: (GI × Carbs in grams) / 100. | 18 (medium) |
| Net carbs ⓘ Net Carbs = Total Carbohydrates – Fiber – Sugar Alcohols | 19 g |
| Default serving size ⓘ Serving sizes are mostly taken from FDA's Reference Amounts Customarily Consumed (RACCs) | 1 cup (185 g) |
| Acidity (Based on PRAL) ⓘ PRAL (Potential renal acid load) is calculated using a formula. On the PRAL scale the higher the positive value, the more is the acidifying effect on the body. The lower the negative value, the higher the alkalinity of the food. 0 is neutral. | 2.3 (acidic) |
| Oxalates | 106 mg ⓘ https://www.researchgate.net/publication/329880400 |
Quinoa calories (kcal)
| Calories for different serving sizes of quinoa | Calories | Weight |
|---|---|---|
| Calories in 100 grams | 120 | |
| Calories in 1 cup | 222 | 185 g |
| Calories for different varieties of quinoa | Calories | Weight |
|---|---|---|
| Quinoa, cooked (this food) | 120 | 100 g |
| Quinoa, uncooked | 368 | 100 g |
Extra Nutrition facts for Quinoa
| Protein per 100 calories ⓘ Shows how many grams of protein you get from 100 calories of this food, calculated as (protein in g ÷ calories) × 100. | 3.7 g |
| Calories per 10 g protein ⓘ Shows how many calories you need to eat from this food to get 10 g of protein, calculated as (calories ÷ protein in g) × 10. | 273 kcal |
| Weight per 100 calories ⓘ Shows how many grams of this food equal 100 kcal—higher grams mean a larger portion for the same calories. | 83 g |
Quinoa Glycemic index (GI)
Quinoa Glycemic load (GL)
Mineral coverage chart
Mineral chart - relative view
Vitamin coverage chart
Vitamin chart - relative view
Protein quality breakdown
Fat type information
All nutrients for Quinoa per 100g
| Nutrient | Value | DV% | In TOP % of foods | Comparison |
| Vitamin A | 0µg | 0% | 100% | |
| Calories | 120kcal | 6% | 69% |
2.6 times more than Orange
|
| Protein per 100 calories | 3.7g | N/A | 54% | |
| Protein | 4.4g | 10% | 64% |
1.6 times more than Broccoli
|
| Calories per 10 g protein | 273kcal | N/A | 43% | |
| Weight per 100 calories | 83g | N/A | 32% | |
| Fats | 1.9g | 3% | 68% |
17.3 times less than Cheese
|
| Vitamin C | 0mg | 0% | 100% |
N/A
|
| Carbs | 21g | 7% | 34% |
1.3 times less than Rice
|
| Net carbs | 19g | N/A | 34% |
2.9 times less than Chocolate
|
| Cholesterol | 0mg | 0% | 100% |
N/A
|
| Vitamin D* | 0 IU | 0% | 100% |
N/A
|
| Vitamin D | 0µg | 0% | 100% |
N/A
|
| Magnesium | 64mg | 15% | 11% |
2.2 times less than Almonds
|
| Calcium | 17mg | 2% | 56% |
7.4 times less than Milk
|
| Potassium | 172mg | 5% | 62% |
1.2 times more than Cucumber
|
| Iron | 1.5mg | 19% | 47% |
1.7 times less than Beef broiled
|
| Sugar | 0.87g | N/A | 47% |
10.3 times less than Coca-Cola
|
| Fiber | 2.8g | 11% | 22% |
1.2 times more than Orange
|
| Copper | 0.19mg | 21% | 19% |
1.4 times more than Shiitake
|
| Zinc | 1.1mg | 10% | 44% |
5.8 times less than Beef broiled
|
| Starch | 18g | 7% | 6% |
1.2 times more than Potato
|
| Phosphorus | 152mg | 22% | 46% |
1.2 times less than Chicken meat
|
| Sodium | 7mg | 0% | 87% |
70 times less than White bread
|
| Vitamin E | 0.63mg | 4% | 20% |
2.3 times less than Kiwi
|
| Manganese | 0.63mg | 27% | 12% | |
| Selenium | 2.8µg | 5% | 55% | |
| Vitamin B1 | 0.11mg | 9% | 39% |
2.5 times less than Pea raw
|
| Vitamin B2 | 0.11mg | 8% | 60% |
1.2 times less than Avocado
|
| Vitamin B3 | 0.41mg | 3% | 74% |
23.2 times less than Turkey meat
|
| Vitamin B6 | 0.12mg | 9% | 50% |
Equal to Oats
|
| Vitamin B12 | 0µg | 0% | 100% |
N/A
|
| Vitamin K | 0µg | 0% | 100% |
N/A
|
| Folate | 42µg | 11% | 23% |
1.5 times less than Brussels sprouts
|
| Saturated fat | 0.23g | 1% | 72% |
25.5 times less than Beef broiled
|
| Choline | 23mg | 4% | 29% | |
| Monounsaturated fat | 0.53g | N/A | 64% |
18.6 times less than Avocado
|
| Polyunsaturated fat | 1.1g | N/A | 37% |
43.8 times less than Walnut
|
| Tryptophan | 0.05mg | 0% | 44% |
5.9 times less than Chicken meat
|
| Threonine | 0.13mg | 0% | 47% |
5.5 times less than Beef broiled
|
| Isoleucine | 0.16mg | 0% | 47% |
5.8 times less than Salmon raw
|
| Leucine | 0.26mg | 0% | 47% |
9.3 times less than Tuna Bluefin
|
| Lysine | 0.24mg | 0% | 43% |
1.9 times less than Tofu
|
| Methionine | 0.1mg | 0% | 43% |
Equal to Quinoa
|
| Phenylalanine | 0.19mg | 0% | 45% |
3.6 times less than Egg
|
| Valine | 0.19mg | 0% | 47% |
11 times less than Soybean raw
|
| Histidine | 0.13mg | 0% | 43% |
5.9 times less than Turkey meat
|
| Caffeine | 0mg | 0% | 100% | |
| Omega-3 - EPA | 0g | N/A | 100% |
N/A
|
| Omega-3 - DHA | 0.02g | N/A | 7% |
97.3 times less than Salmon
|
| Omega-3 - DPA | 0g | N/A | 100% |
N/A
|
Check out similar food or compare with current
NUTRITION FACTS LABEL
Serving Size ______________
Health checks
Quinoa nutrition infographic
References
All the values for which the sources are not specified explicitly are taken from FDA’s Food Central. The exact link to the food presented on this page can be found below.