Quinoa vs Rice Nutritional Value - Carbs, Glycemic Index, Calories & More


Summary
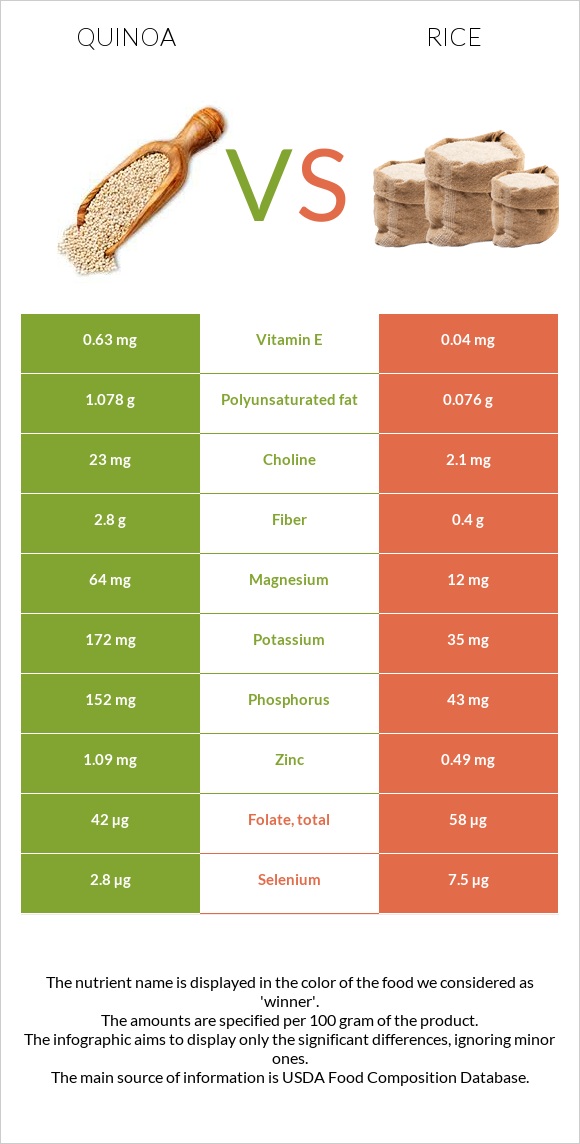
In summary, quinoa is 1.6 times richer in protein, 7 times richer in fat and dietary fiber compared to white rice. Quinoa is 16 times richer in vitamin E and over 6 times richer in vitamin B2, whereas white rice is higher in calories and net carbs, as well as vitamins B1, B3, folate, and selenium.
Whole-grain brown rice has nutritional superiority over refined white rice.
Quinoa and brown rice are associated with more beneficial impacts on health as a healthy pseudocereal, rich in dietary fiber, proteins, and anti-inflammatory phytochemicals, whereas refined or white rice lacks dietary fiber, minerals, and vitamins due to having the germ and the bran removed.
Introduction
Quinoa and rice are crops that have been known to humanity for centuries. On the one hand, we have rice - one of the most consumed cereal grains worldwide, and on the other hand, there is quinoa, which started gaining popularity again in recent years. In this article, the two will be compared for their nutritional quality and impact on health.
Classification
Rice is the seed of swamp grass belonging to the Oryza genus and the sativa (Asian rice) or glaberrima (African rice) species. The grass belongs to the Poaceae or Gramineae family, also known as grasses, and includes corn, wheat, millets, rye, and barley.
Quinoa belongs to the Chenopodium genus and Amaranthaceae family. The Amaranth family includes pseudocereal amaranth, lamb’s quarter, spinach, beets, and chard.
Quinoa is classified as a pseudocereal, whereas brown rice is a whole grain and white rice is a refined grain.
Appearance
Rice grains have long, thin seeds. Depending on the variety, rice can be white, red, brown, or black.
Uncooked quinoa looks like birdseed, whereas cooked quinoa pops open and is described to look like worms or tadpoles. Quinoa also comes in different colors, such as white, red, and black.
Types & Varieties
Rice, classified by its kernel size, can be long-grain (jasmine and basmati rice), medium-grain (risotto rice: carnaroli and arborio, japonica rice, forbidden black rice), and short-grain (sushi rice and glutinous rice).
Rice color differs by the degree of milling or hulling. White rice has the hull, bran, and germ removed, while brown, red, and black rice have only their hulls removed. Due to being inedible, the hull is removed in all types of rice.
Wild rice is not directly related to rice species.
The most common types of quinoa are red, white, black, tri-color or rainbow quinoa, quinoa flakes, and quinoa flour.
Quinoa flakes are mechanically pressed quinoa grains.
Quinoa flour is a commonly used alternative to wheat flour, as it is similar in texture and taste but is gluten-free.
Nutrition
Nutritional values in this article are presented for 100g servings of cooked, enriched, long-grained white rice and cooked quinoa.
Macronutrients and Calories
Rice is denser in nutrients compared to quinoa. Quinoa contains 72% water, while brown rice contains 70%, and white rice contains 68% water.
Macronutrient Comparison
Contains
more
ProteinProtein
+63.6%
Contains
more
FatsFats
+585.7%
Contains
more
OtherOther
+83.3%
Contains
more
CarbsCarbs
+32.3%
The serving size of these foods is one cup. One cup of quinoa weighs 185g. One cup of white rice is 158g, whereas one cup of brown rice weighs 202g.
Calories
Both of these foods are high-calorie foods. A hundred grams of quinoa contains 120 calories. A hundred grams of brown rice contains 123 calories, while the same serving of white rice has 130 calories.
Carbohydrates
Rice and quinoa are high in carbohydrates; however, white rice contains 7g more carbohydrates per 100g serving.
Quinoa contains a higher level of dietary fiber. It contains 1.75 times more dietary fiber than brown rice and 7 times more than white rice. Due to having outer layers removed from white rice, it contains low levels of dietary fiber.
White rice provides 9g more net carbs or digestible carbs per 100g serving. Equal 100g servings of white rice and quinoa contain 27.8g and 18.5g of net carbs, respectively.
Most of the net carbs found in these grains are made up of starch.
Protein
Quinoa is richer in proteins compared to rice, providing 4.4g of protein per 100g serving, while white rice has 2.7g.
Quinoa and rice contain some levels of all essential amino acids. Quinoa is over 2 times richer in histidine and lysine and higher in other amino acids as well.
Fats
These foods are low in fats. Nonetheless, quinoa contains almost 7 times more fat than white rice and almost 2 times more fat than brown rice.
Fat Type Comparison
Contains
more
Mono. FatMonounsaturated fat
+500%
Contains
more
Poly. FatPolyunsaturated fat
+1318.4%
Contains
less
Sat. FatSaturated fat
-66.7%
Quinoa and rice are naturally absent in cholesterol.
Vitamins
Quinoa is almost 8.5 times richer in vitamin B2 than white rice and 1.5 times richer than brown rice. It is also 16 times richer in vitamin E than white rice and 3.7 times richer than brown rice.
Vitamin B3 - brown rice is over six times richer in vitamin B3 than quinoa. Brown rice is richer in this vitamin compared to white rice as well.
Enriched white rice is slightly higher in vitamin B9 or folate than quinoa. White rice is also a better source of vitamins B1 and B5.
Quinoa and rice are absent in vitamins C, D, and B12. Some vitamin A levels are found only in quinoa.
Vitamin Comparison
Contains
more
Vitamin EVitamin E
+1475%
Contains
more
Vitamin B2Vitamin B2
+746.2%
Contains
more
Vitamin B6Vitamin B6
+32.3%
Contains
more
Vitamin B1Vitamin B1
+52.3%
Contains
more
Vitamin B3Vitamin B3
+258.3%
Contains
more
FolateFolate
+38.1%
Minerals
Quinoa is richer in all principal minerals compared to white rice: iron, calcium, potassium, magnesium, manganese, copper, zinc, phosphorus, and choline. Quinoa is richer in all minerals, except for manganese, compared to brown rice.
More specifically, quinoa provides 5 times more potassium and magnesium, 4 times more phosphorus, and 3 times more copper.
On the other hand, brown rice is richer in most minerals, except for iron and calcium, compared to white rice.
White rice contains less sodium compared to brown rice and quinoa. Enriched white rice is also almost 3 times higher in selenium.
Mineral Comparison
Contains
more
MagnesiumMagnesium
+433.3%
Contains
more
CalciumCalcium
+70%
Contains
more
PotassiumPotassium
+391.4%
Contains
more
IronIron
+24.2%
Contains
more
CopperCopper
+178.3%
Contains
more
ZincZinc
+122.4%
Contains
more
PhosphorusPhosphorus
+253.5%
Contains
more
ManganeseManganese
+33.7%
Contains
less
SodiumSodium
-85.7%
Contains
more
SeleniumSelenium
+167.9%
Glycemic Index
One quinoa variety is studied to be a medium glycemic index food. The glycemic index of cooked quinoa ranges from 51 to 78, with an average of 63 (1). However, according to The International Tables of Glycemic Index Values, the mean glycemic index of cooked quinoa is low, equal to 53±5 (2).
The glycemic index of rice varies depending on its variety, dietary fiber content, cooking method, and brand.
The average glycemic index of cooked white Basmati rice is 60 while quick-cooking Basmati rice has a higher glycemic value of 65. Jasmine white rice has a significantly higher glycemic index value of 89 (2).
As expected, brown rice has a lower average glycemic index of 50 (2).
Overall, rice has a wide range of glycemic indices, tending to fall from the medium to high category.
Insulin Index
The insulin index demonstrates how much the intake of a certain food raises insulin index levels in the blood.
The insulin index of brown rice is 62, whereas the insulin index of white rice is 79 (3). The insulin indices for Basmati and Jasmine rice are 57 and 76, respectively (4). These are medium to high insulin index values.
The insulin index value of quinoa has not yet been researched.
Acidity
Rice is considered to be slightly acidic. The pH value of cooked white rice ranges from 6.00 to 6.70. The pH value of cooked brown rice falls from 6.20 to 6.80. On the other hand, rice crispies are more acidic, with a pH value ranging from 5.40 to 5.73 (5).
Quinoa, in particular children’s quinoa, can be from slightly acidic to neutral, with a pH value ranging from 6.22 to 6.98 (6).
The PRAL or potential renal acid load value shows how much base or acid the consumed food produces in the organism.
The PRAL values for quinoa and white rice have been calculated to be 2.3 and 1.7, respectively. This means quinoa is more acid-producing.
Weight Loss & Diets
Even though these foods are high in calories, they are also rich in proteins, minerals, and vitamins and low in fats. Quinoa is also rich in dietary fiber as well.
Quinoa is the better choice for low-calorie and low-carb diets. On the other hand, rice is a better choice for a low-fat diet.
Both quinoa and rice can be consumed during the DASH diet.
Quinoa and brown rice are consumed during the Mediterranean and anti-inflammatory diets as well. As a refined grain, white rice doesn’t suit these diets.
White rice is part of the BRAT diet, consisting of bananas, rice, applesauce, and toast. The BRAT diet was recommended for nausea, vomiting, and diarrhea; however, the experts say the diet has not been proven to work and can even lead to malnutrition and prolonged symptoms.
Several studies suggest that white rice consumption, but not brown, mixed, or multi-grain rice, may lead to body weight gain (7, 8). Compared to white rice, a brown rice diet may decrease weight, waist and hip circumference, and BMI (9). Quinoa consumption is also associated with body weight loss, reduced appetite, and improved lipid profile (10).
Health Impact
Quinoa is a healthy pseudocereal, rich in dietary fiber, proteins, and anti-inflammatory phytochemicals, whereas refined or white rice lacks dietary fiber, minerals, and vitamins due to having the germ and the bran removed. This section will provide information about the health benefits and risks of these foods.
Health Benefits
Cardiovascular Health
Daily consumption of 50g of quinoa lowers serum triglyceride and total cholesterol levels. Reduced triglyceride levels may potentially lower the risk of cardiovascular disease (10). The current evidence suggests quinoa may be effective in preventing and controlling cardiovascular disease in humans; however, more research needs to be done (11).
Quinoa and brown rice are rich in dietary fiber. Dietary fiber is inversely associated with cardiovascular and coronary heart disease and atherosclerosis risks. Dietary fiber intake may also reduce arterial blood pressure (12, 13).
Several large studies have concluded that greater white or brown rice consumption is not associated with an increased risk of cardiovascular or coronary heart disease (14, 15).
However, white rice is positively associated with several cardiovascular risk factors, such as type 2 diabetes and metabolic syndrome. Nonetheless, another study claims it adds no additional risk of cardiovascular disease (14, 16).
Diabetes
Quinoa’s secondary bioactive metabolites are known to have antioxidant, cytotoxic, antidiabetic, and anti-inflammatory properties. Several components, such as dietary fiber, protein, 20HE, and polyphenols, may be protective against type 2 diabetes and metabolic complications of obesity (17, 18).
Substitution of brown rice for white rice may lower the risk of type 2 diabetes and positively affect blood glucose levels (19, 20).
Digestive Health
Due to its potential prebiotic effects, quinoa may improve gastrointestinal health by enhancing beneficial bacteria growth (21, 22).
One animal study has demonstrated that differently processed red quinoa seeds revealed gastroprotective effects against alcohol-induced acute stomach injury (23).
As previously mentioned, quinoa and brown rice are rich in dietary fiber, which is studied to be protective against certain gastrointestinal diseases: constipation, hemorrhoids, colon cancer, diverticulitis, duodenal ulcer, irritable bowel syndrome, and inflammatory bowel disease (24, 25, 26, 27).
Cancer
Several isoflavones and other bioactive compounds found in quinoa are studied to have cytotoxic, anticancer, antiproliferative, or chemoprotective activity on hormone-independent cervical, breast, prostate cancer cells, leukemia, and potentially colon cancer cells (17).
A multi-grain rice diet may be inversely associated with the risk of breast cancer (28).
Rice by-products contain phytochemicals that can act as chemopreventive dietary agents (29).
One study has concluded that long-term consumption of white or brown rice has not been associated with a higher risk of developing cancer (30).
Downsides and Risks
Diabetes
Higher regular consumption of white rice is associated with an increased risk of type 2 diabetes. The risks are more significant in South Asian countries (31, 32).
Replacing refined grains, such as white rice and white bread, with whole grains, such as brown rice, dark bread, and bran, may reduce the risk of developing type 2 diabetes (33).
Metal Poisoning
Brown and white rice have been reported to have high median concentrations of toxic heavy metals: arsenic, cadmium, lead, and chromium. However, only arsenic concentrations have been reported to exceed the codex standard.
The germ layer in brown rice has been shown to retain inorganic arsenic, leading to a higher arsenic concentration level compared to white rice (34).
According to the World Health Organization, long-term exposure to arsenic can cause bladder and lung cancers, as well as skin lesions. It has been associated with an increased risk of cardiovascular and pulmonary disease, diabetes, adverse pregnancy outcomes, and neurocognitive defects in children (35).
Alternating or coupling rice with other grains, such as wheat, barley, lentils, oats, beans, or peas, may reduce exposure to toxic metals and provide more essential nutrients to the rice diet (34).
References
- https://www.researchgate.net/publication/323555199
- https://academic.oup.com/ajcn/article/114/5/1625/6320814
- https://academic.oup.com/ajcn/article/66/5/1264/4655967
- https://pubmed.ncbi.nlm.nih.gov/25789978/
- pH values of foods and food products
- http://www.nphsystem.guide/grain_food_values.htm
- https://www.sciencedirect.com/science/article/abs/pii/S0271531707002874
- https://pubmed.ncbi.nlm.nih.gov/30312545/
- https://www.ncbi.nlm.nih.gov/pmc/articles/PMC4018597/
- https://www.ncbi.nlm.nih.gov/pmc/articles/PMC5998774/
- https://onlinelibrary.wiley.com/doi/10.1002/ptr.6901
- https://www.mdpi.com/2072-6643/11/5/1155/htm
- https://pubmed.ncbi.nlm.nih.gov/26923351/
- https://academic.oup.com/ajcn/article/100/1/199/4576494
- https://academic.oup.com/ajcn/article/101/1/164/4564257
- https://www.ncbi.nlm.nih.gov/pmc/articles/PMC4530655/
- https://www.ncbi.nlm.nih.gov/pmc/articles/PMC6651730/
- https://www.mdpi.com/2673-4540/2/2/7/htm
- White Rice, Brown Rice, and Risk of Type 2 Diabetes in US Men and Women
- https://www.ncbi.nlm.nih.gov/pmc/articles/PMC6948352/
- https://www.ncbi.nlm.nih.gov/pmc/articles/PMC6175902/
- https://www.ncbi.nlm.nih.gov/pmc/articles/PMC8498072/
- https://www.ncbi.nlm.nih.gov/pmc/articles/PMC7275209/
- https://pubmed.ncbi.nlm.nih.gov/24876314/
- https://www.cell.com/cell-host-microbe/fulltext/S1931-3128(18)30266-X
- https://pubmed.ncbi.nlm.nih.gov/26811635/
- https://pubmed.ncbi.nlm.nih.gov/28731144/
- https://www.ncbi.nlm.nih.gov/pmc/articles/PMC7468941/
- https://www.ncbi.nlm.nih.gov/pmc/articles/PMC5292171/
- https://www.ncbi.nlm.nih.gov/pmc/articles/PMC4919813/
- https://pubmed.ncbi.nlm.nih.gov/22422870/
- https://pubmed.ncbi.nlm.nih.gov/32873587/
- https://academic.oup.com/ajcn/article/76/3/535/4677418
- https://www.ncbi.nlm.nih.gov/pmc/articles/PMC7663342/
- https://www.sciencedirect.com/science/article/pii/S187853521400032X

Infographic
All nutrients comparison - raw data values
| Nutrient | |
|
DV% diff. |
| Phosphorus | 152mg | 43mg | 16% |
| Copper | 0.192mg | 0.069mg | 14% |
| Magnesium | 64mg | 12mg | 12% |
| Fiber | 2.8g | 0.4g | 10% |
| Selenium | 2.8µg | 7.5µg | 9% |
| Vitamin B5 | 0.39mg | 8% | |
| Starch | 17.63g | 7% | |
| Manganese | 0.631mg | 0.472mg | 7% |
| Vitamin B2 | 0.11mg | 0.013mg | 7% |
| Vitamin B3 | 0.412mg | 1.476mg | 7% |
| Polyunsaturated fat | 1.078g | 0.076g | 7% |
| Zinc | 1.09mg | 0.49mg | 5% |
| Vitamin B1 | 0.107mg | 0.163mg | 5% |
| Potassium | 172mg | 35mg | 4% |
| Iron | 1.49mg | 1.2mg | 4% |
| Vitamin E | 0.63mg | 0.04mg | 4% |
| Folate | 42µg | 58µg | 4% |
| Choline | 23mg | 2.1mg | 4% |
| Protein | 4.4g | 2.69g | 3% |
| Fats | 1.92g | 0.28g | 3% |
| Carbs | 21.3g | 28.17g | 2% |
| Vitamin B6 | 0.123mg | 0.093mg | 2% |
| Calories | 120kcal | 130kcal | 1% |
| Calcium | 17mg | 10mg | 1% |
| Saturated fat | 0.231g | 0.077g | 1% |
| Monounsaturated fat | 0.528g | 0.088g | 1% |
| Protein per 100 calories | 3.7g | 2.1g | N/A |
| Calories per 10 g protein | 273kcal | 483kcal | N/A |
| Weight per 100 calories | 83g | 77g | N/A |
| Net carbs | 18.5g | 27.77g | N/A |
| Sugar | 0.87g | 0.05g | N/A |
| Sodium | 7mg | 1mg | 0% |
| Tryptophan | 0.052mg | 0.031mg | 0% |
| Threonine | 0.131mg | 0.096mg | 0% |
| Isoleucine | 0.157mg | 0.116mg | 0% |
| Leucine | 0.261mg | 0.222mg | 0% |
| Lysine | 0.239mg | 0.097mg | 0% |
| Methionine | 0.096mg | 0.063mg | 0% |
| Phenylalanine | 0.185mg | 0.144mg | 0% |
| Valine | 0.185mg | 0.164mg | 0% |
| Histidine | 0.127mg | 0.063mg | 0% |
| Omega-3 - DHA | 0.015g | 0g | N/A |
People also compare


References
All the values for which the sources are not specified explicitly are taken from FDA’s Food Central. The exact link to the food presented on this page can be found below.
- Quinoa - https://fdc.nal.usda.gov/fdc-app.html#/food-details/168917/nutrients
- Rice - https://fdc.nal.usda.gov/fdc-app.html#/food-details/168878/nutrients
All the Daily Values are presented for males aged 31-50, for 2000-calorie diets.