
Canadian bacon vs. Frankfurter — In-Depth Nutrition Comparison
Compare
Significant differences between Canadian bacon and frankfurter
- Canadian bacon has more selenium, vitamin B1, vitamin B3, protein, phosphorus, potassium, and vitamin B2; however, frankfurter is richer in vitamin B12 and fats.
- Canadian bacon covers your daily selenium needs 73% more than frankfurter.
- Frankfurter has 37 times less vitamin B1 than Canadian bacon. Canadian bacon has 0.669mg of vitamin B1, while frankfurter has 0.018mg.
- Canadian bacon contains less saturated fat.
Specific food types used in this comparison are Canadian bacon, cooked, pan-fried and Frankfurter, beef, unheated.
Infographic
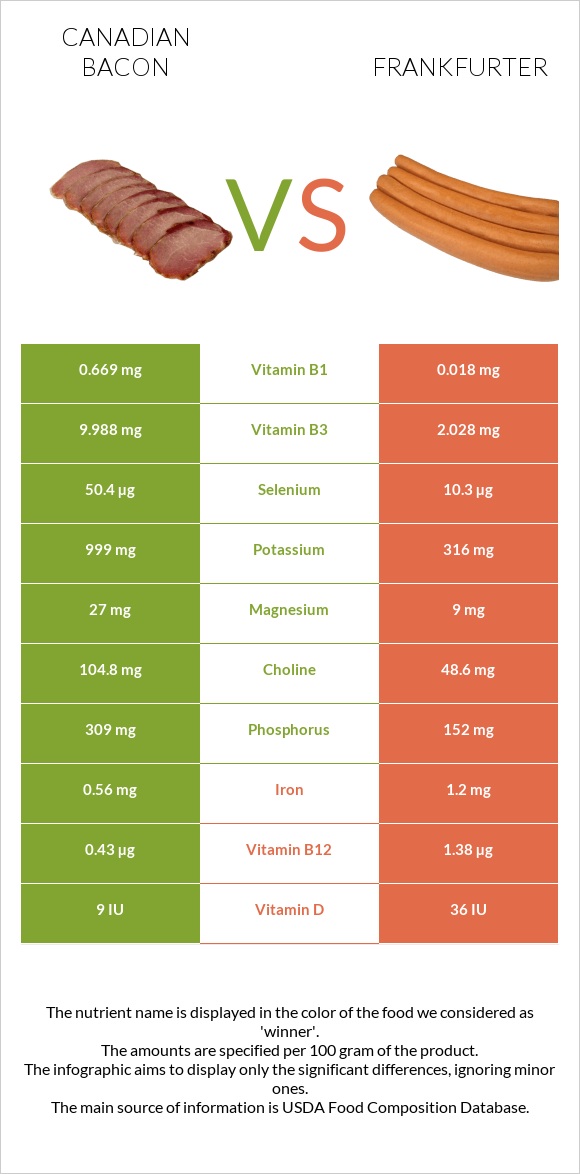
Infographic link
Mineral Comparison
The mineral comparison score is based on which food has a more favorable amount of each mineral. The �coverage� charts below show how much of the daily mineral needs are covered by the selected amount of each food.
| Contains more MagnesiumMagnesium | +200% |
| Contains more PotassiumPotassium | +216.1% |
| Contains more CopperCopper | +14.5% |
| Contains more PhosphorusPhosphorus | +103.3% |
| Contains more SeleniumSelenium | +389.3% |
| Contains more CalciumCalcium | +71.4% |
| Contains more IronIron | +114.3% |
| Contains more ZincZinc | +17.3% |
| Contains more ManganeseManganese | +31.3% |
Vitamin Comparison
The vitamin comparison score is based on the number of vitamins in which one food is richer than the other. The �coverage� charts below show how much of the daily vitamin needs are covered by the selected amount of each food.
| Contains more Vitamin EVitamin E | +105% |
| Contains more Vitamin B1Vitamin B1 | +3616.7% |
| Contains more Vitamin B2Vitamin B2 | +330.2% |
| Contains more Vitamin B3Vitamin B3 | +392.5% |
| Contains more Vitamin B5Vitamin B5 | +∞% |
| Contains more Vitamin B6Vitamin B6 | +51.4% |
| Contains more Vitamin DVitamin D | +350% |
| Contains more Vitamin B12Vitamin B12 | +220.9% |
| Contains more Vitamin KVitamin K | +800% |
| Contains more FolateFolate | +150% |
All nutrients comparison - raw data values
| Nutrient |  |
 |
DV% diff. |
| Selenium | 50.4µg | 10.3µg | 73% |
| Vitamin B1 | 0.669mg | 0.018mg | 54% |
| Vitamin B3 | 9.988mg | 2.028mg | 50% |
| Saturated fat | 1.039g | 10.979g | 45% |
| Vitamin B12 | 0.43µg | 1.38µg | 40% |
| Fats | 2.78g | 28.3g | 39% |
| Protein | 28.31g | 11.16g | 34% |
| Monounsaturated fat | 1.255g | 12.048g | 27% |
| Phosphorus | 309mg | 152mg | 22% |
| Potassium | 999mg | 316mg | 20% |
| Vitamin B5 | 0.72mg | 14% | |
| Vitamin B2 | 0.185mg | 0.043mg | 11% |
| Choline | 104.8mg | 48.6mg | 10% |
| Calories | 146kcal | 316kcal | 9% |
| Iron | 0.56mg | 1.2mg | 8% |
| Vitamin B6 | 0.28mg | 0.185mg | 7% |
| Cholesterol | 67mg | 55mg | 4% |
| Vitamin D | 0.2µg | 0.9µg | 4% |
| Magnesium | 27mg | 9mg | 4% |
| Vitamin D* | 9 IU | 36 IU | 3% |
| Zinc | 1.73mg | 2.03mg | 3% |
| Folate | 4µg | 10µg | 2% |
| Polyunsaturated fat | 0.485g | 0.765g | 2% |
| Omega-6 (Linoleic acid) | 0.36g | 2% | |
| Carbs | 1.8g | 3.36g | 1% |
| Calcium | 7mg | 12mg | 1% |
| Copper | 0.063mg | 0.055mg | 1% |
| Vitamin E | 0.41mg | 0.2mg | 1% |
| Vitamin K | 0.2µg | 1.8µg | 1% |
| Omega-3 (ALA) | 0.011g | 1% | |
| Protein per 100 calories | 19g | 3.5g | N/A |
| Calories per 10 g protein | 52kcal | 283kcal | N/A |
| Weight per 100 calories | 68g | 32g | N/A |
| Unsaturated / Saturated Fat ratio | 1.7 | 1.2 | N/A |
| Net carbs | 1.8g | 3.36g | N/A |
| Sugar | 1.2g | 1.31g | N/A |
| Sodium | 993mg | 992mg | 0% |
| Manganese | 0.016mg | 0.021mg | 0% |
| Trans fat | 0.008g | N/A | |
| Tryptophan | 0.332mg | 0.121mg | 0% |
| Threonine | 1.226mg | 0.519mg | 0% |
| Isoleucine | 1.32mg | 0.58mg | 0% |
| Leucine | 2.294mg | 0.994mg | 0% |
| Lysine | 2.479mg | 1.055mg | 0% |
| Methionine | 0.764mg | 0.319mg | 0% |
| Phenylalanine | 1.158mg | 0.487mg | 0% |
| Valine | 1.41mg | 0.608mg | 0% |
| Histidine | 1.134mg | 0.362mg | 0% |
| Omega-3 (DHA) | 0.001g | 0g | N/A |
| Omega-3 (DPA) | 0.006g | 0g | N/A |
| Omega-3 (Eicosatrienoic acid) | 0.003g | N/A | |
| Omega-6 (Gamma-linolenic acid) | 0.001g | N/A | |
| Omega-6 (Dihomo-gamma-linolenic acid) | 0.008g | N/A | |
| Omega-6 (Eicosadienoic acid) | 0.014g | N/A |
Macronutrient Comparison
Macronutrient breakdown side-by-side comparison
Protein:
28.31 g
Fats:
2.78 g
Carbs:
1.8 g
Water:
62.5 g
Other:
4.61 g
Protein:
11.16 g
Fats:
28.3 g
Carbs:
3.36 g
Water:
53.94 g
Other:
3.24 g
| Contains more ProteinProtein | +153.7% |
| Contains more WaterWater | +15.9% |
| Contains more FatsFats | +918% |
| Contains more CarbsCarbs | +86.7% |
Fat Type Comparison
Fat type breakdown side-by-side comparison
Saturated fat:
Sat. Fat
1.039 g
Monounsaturated fat:
Mono. Fat
1.255 g
Polyunsaturated fat:
Poly. Fat
0.485 g
Saturated fat:
Sat. Fat
10.979 g
Monounsaturated fat:
Mono. Fat
12.048 g
Polyunsaturated fat:
Poly. Fat
0.765 g
| Contains less Sat. FatSaturated fat | -90.5% |
| Contains more Mono. FatMonounsaturated fat | +860% |
| Contains more Poly. FatPolyunsaturated fat | +57.7% |
Carbohydrate type comparison
Carbohydrate type breakdown side-by-side comparison
Starch:
0 g
Sucrose:
0.9 g
Glucose:
0.3 g
Fructose:
0 g
Lactose:
0 g
Maltose:
0 g
Galactose:
0 g
Starch:
0 g
Sucrose:
0 g
Glucose:
1.12 g
Fructose:
0 g
Lactose:
0 g
Maltose:
0.18 g
Galactose:
0 g
| Contains more SucroseSucrose | +∞% |
| Contains more GlucoseGlucose | +273.3% |
| Contains more MaltoseMaltose | +∞% |
~equal in
Starch
~0g
~equal in
Fructose
~0g
~equal in
Lactose
~0g
~equal in
Galactose
~0g


