How are candy bar and milkshake different? Candy bar is richer in vitamin B6, copper, manganese, vitamin B3, zinc, phosphorus, vitamin E, magnesium, and folate, while milkshake is higher in vitamin B12. Candy bar covers your daily need for vitamin B6, 11766% more than milkshake. Candy bar contains 89 times more manganese than milkshake. Candy bar contains 1.243mg of manganese, while milkshake contains 0.014mg. Candy bar has a higher glycemic index (51) than milkshake (27). Candies, peanut bar and Milk shakes, thick vanilla types were used in this article.
Infographic
Mineral Comparison
Mineral comparison score is based on the number of minerals by which one or the other food is richer. The "coverage" charts below show how much of the daily needs can be covered by 300 grams of the food.
8
100 g
300 g
1 oz - 28.35g 1 bar (1.4 oz) - 40g 1 bar (1.6 oz) - 45g 1 bar (1.75 fl oz) - 50g
Magnesium
Magnesium
Calcium
Calcium
Potassium
Potassium
Iron
Iron
Copper
Copper
Zinc
Zinc
Phosphorus
Phosphorus
Sodium
Sodium
Manganese
Manganese
Selenium
Selenium
79%
23%
36%
36%
258%
107%
132%
20%
162%
26%
2
100 g
300 g
1 fl oz - 28.4g 1 container (11 oz) - 313g
Magnesium
Magnesium
Calcium
Calcium
Potassium
Potassium
Iron
Iron
Copper
Copper
Zinc
Zinc
Phosphorus
Phosphorus
Sodium
Sodium
Manganese
Manganese
Selenium
Selenium
8.6%
44%
16%
3.8%
17%
11%
49%
12%
1.8%
13%
Vitamin Comparison
Vitamin comparison score is based on the number of vitamins by which one or the other food is richer. The "coverage" charts below show how much of the daily needs can be covered by 300 grams of the food.
6
100 g
300 g
1 oz - 28.35g 1 bar (1.4 oz) - 40g 1 bar (1.6 oz) - 45g 1 bar (1.75 fl oz) - 50g
Vitamin C
Vit. C
Vitamin D
Vit. D
Vitamin A
Vit. A
Vitamin E
Vit. E
Vitamin B1
Vit. B1
Vitamin B2
Vit. B2
Vitamin B3
Vit. B3
Vitamin B5
Vit. B5
Vitamin B6
Vit. B6
Vitamin B12
Vit. B12
Vitamin K
Vit. K
Folate
Folate
0%
0%
0%
82%
25%
32%
149%
50%
35308%
0%
0%
56%
5
100 g
300 g
1 fl oz - 28.4g 1 container (11 oz) - 313g
Vitamin C
Vit. C
Vitamin D
Vit. D
Vitamin A
Vit. A
Vitamin E
Vit. E
Vitamin B1
Vit. B1
Vitamin B2
Vit. B2
Vitamin B3
Vit. B3
Vitamin B5
Vit. B5
Vitamin B6
Vit. B6
Vitamin B12
Vit. B12
Vitamin K
Vit. K
Folate
Folate
0%
18%
8.3%
1%
7.5%
45%
2.7%
22%
9.7%
65%
0.5%
5.3%
All nutrients comparison - raw data values
Nutrient
DV% diff.
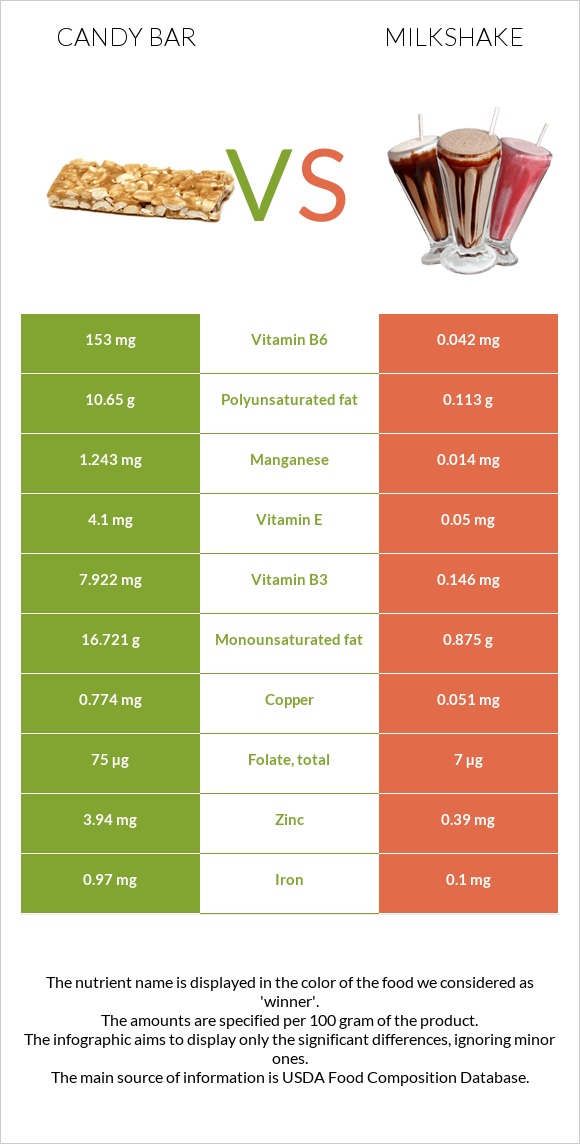
Vitamin B6
153mg
0.042mg
11766%
Copper
0.774mg
0.051mg
80%
Polyunsaturated fat
10.65g
0.113g
70%
Manganese
1.243mg
0.014mg
53%
Vitamin B3
7.922mg
0.146mg
49%
Fats
33.7g
3.03g
47%
Monounsaturated fat
16.721g
0.875g
40%
Zinc
3.94mg
0.39mg
32%
Phosphorus
308mg
115mg
28%
Vitamin E
4.1mg
0.05mg
27%
Protein
15.5g
3.86g
23%
Magnesium
110mg
12mg
23%
Vitamin B12
0µg
0.52µg
22%
Calories
522kcal
112kcal
21%
Folate
75µg
7µg
17%
Fiber
4.1g
0g
16%
Saturated fat
4.678g
1.886g
13%
Iron
0.97mg
0.1mg
11%
Carbs
47.4g
17.75g
10%
Vitamin B5
0.83mg
0.368mg
9%
Calcium
78mg
146mg
7%
Potassium
407mg
183mg
7%
Vitamin D*
0 IU
48 IU
6%
Vitamin D
0µg
1.2µg
6%
Vitamin B1
0.1mg
0.03mg
6%
Cholesterol
0mg
12mg
4%
Selenium
4.7µg
2.3µg
4%
Vitamin B2
0.14mg
0.195mg
4%
Sodium
156mg
95mg
3%
Vitamin A
0µg
25µg
3%
Choline
29.4mg
14.3mg
3%
Protein per 100 calories
3g
3.4g
N/A
Calories per 10 g protein
337kcal
290kcal
N/A
Weight per 100 calories
19g
89g
N/A
Unsaturated / Saturated Fat ratio
5.9
0.52
N/A
Net carbs
43.3g
17.75g
N/A
Sugar
42.22g
17.75g
N/A
Vitamin K
0µg
0.2µg
0%
Tryptophan
0.149mg
0.054mg
0%
Threonine
0.52mg
0.174mg
0%
Isoleucine
0.534mg
0.234mg
0%
Leucine
0.986mg
0.378mg
0%
Lysine
0.545mg
0.306mg
0%
Methionine
0.185mg
0.097mg
0%
Phenylalanine
0.787mg
0.186mg
0%
Valine
0.638mg
0.258mg
0%
Histidine
0.385mg
0.105mg
0%
Macronutrient Comparison
Macronutrient breakdown side-by-side comparison
4
16%
34%
47%
2%
Protein:
15.5 g
Fats:
33.7 g
Carbs:
47.4 g
Water:
1.6 g
Other:
1.8 g
1
4%
3%
18%
74%
Protein:
3.86 g
Fats:
3.03 g
Carbs:
17.75 g
Water:
74.45 g
Other:
0.91 g
Contains
more
Protein Protein
+301.6%
Contains
more
Fats Fats
+1012.2%
Contains
more
Carbs Carbs
+167%
Contains
more
Other Other
+97.8%
Contains
more
Water Water
+4553.1%
Fat Type Comparison
Fat type breakdown side-by-side comparison
2
15%
52%
33%
Saturated fat:
Sat. Fat
4.678 g
Monounsaturated fat:
Mono. Fat
16.721 g
Polyunsaturated fat:
Poly. Fat
10.65 g
1
66%
30%
4%
Saturated fat:
Sat. Fat
1.886 g
Monounsaturated fat:
Mono. Fat
0.875 g
Polyunsaturated fat:
Poly. Fat
0.113 g
Contains
more
Mono. Fat Monounsaturated fat
+1811%
Contains
more
Poly. Fat Polyunsaturated fat
+9324.8%
Contains
less
Sat. Fat Saturated fat
-59.7%