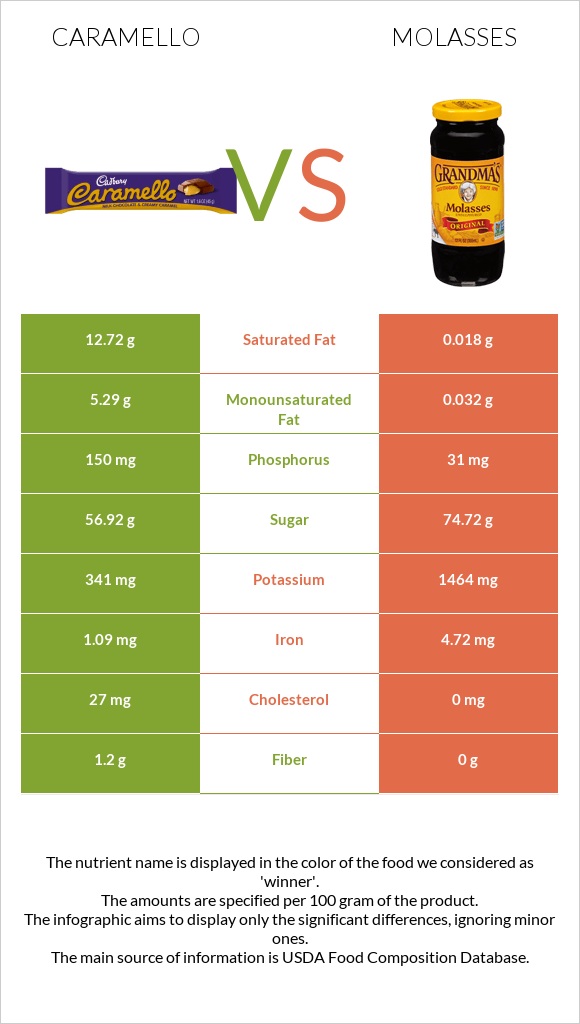
How are caramello and molasses different? Caramello is higher in phosphorus, vitamin A, and monounsaturated fat; however, molasses are richer in iron and potassium. Daily need coverage for saturated fat for caramello is 64% higher. Candies, CARAMELLO Candy Bar and Molasses are the varieties used in this article.
Infographic
Mineral Comparison
Mineral comparison score is based on the number of minerals by which one or the other food is richer. The "coverage" charts below show how much of the daily needs can be covered by 300 grams of the food.
1
100 g
300 g
1 bar 1.25 oz - 35g 6 blocks - 43g 1 bar 1.6 oz - 45g
Magnesium
Magnesium
Calcium
Calcium
Potassium
Potassium
Iron
Iron
Copper
Copper
Zinc
Zinc
Phosphorus
Phosphorus
Sodium
Sodium
Manganese
Manganese
Selenium
Selenium
0%
64%
30%
41%
0%
0%
64%
16%
0%
0%
8
100 g
300 g
1 serving 1 tbsp - 20g 1 cup - 337g
Magnesium
Magnesium
Calcium
Calcium
Potassium
Potassium
Iron
Iron
Copper
Copper
Zinc
Zinc
Phosphorus
Phosphorus
Sodium
Sodium
Manganese
Manganese
Selenium
Selenium
173%
62%
129%
177%
162%
7.9%
13%
4.8%
200%
97%
Vitamin Comparison
Vitamin comparison score is based on the number of vitamins by which one or the other food is richer. The "coverage" charts below show how much of the daily needs can be covered by 300 grams of the food.
1
100 g
300 g
1 bar 1.25 oz - 35g 6 blocks - 43g 1 bar 1.6 oz - 45g
Vitamin C
Vit. C
Vitamin D
Vit. D
Vitamin A
Vit. A
Vitamin E
Vit. E
Vitamin B1
Vit. B1
Vitamin B2
Vit. B2
Vitamin B3
Vit. B3
Vitamin B5
Vit. B5
Vitamin B6
Vit. B6
Vitamin B12
Vit. B12
Vitamin K
Vit. K
Folate
Folate
5.7%
0%
0%
0%
0%
0%
0%
0%
0%
0%
0%
0%
5
100 g
300 g
1 serving 1 tbsp - 20g 1 cup - 337g
Vitamin C
Vit. C
Vitamin D
Vit. D
Vitamin A
Vit. A
Vitamin E
Vit. E
Vitamin B1
Vit. B1
Vitamin B2
Vit. B2
Vitamin B3
Vit. B3
Vitamin B5
Vit. B5
Vitamin B6
Vit. B6
Vitamin B12
Vit. B12
Vitamin K
Vit. K
Folate
Folate
0%
0%
0%
0%
10%
0.46%
17%
48%
155%
0%
0%
0%
All nutrients comparison - raw data values
Nutrient
DV% diff.
Manganese
1.53mg
67%
Magnesium
242mg
58%
Saturated fat
12.72g
0.018g
58%
Copper
0.487mg
54%
Vitamin B6
0.67mg
52%
Iron
1.09mg
4.72mg
45%
Potassium
341mg
1464mg
33%
Fats
21.19g
0.1g
32%
Selenium
17.8µg
32%
Phosphorus
150mg
31mg
17%
Vitamin B5
0.804mg
16%
Fructose
12.79g
16%
Monounsaturated fat
5.29g
0.032g
13%
Protein
6.19g
0g
12%
Calories
462kcal
290kcal
9%
Cholesterol
27mg
0mg
9%
Vitamin B3
0.93mg
6%
Fiber
1.2g
0g
5%
Carbs
63.81g
74.73g
4%
Sodium
122mg
37mg
4%
Polyunsaturated fat
0.63g
0.05g
4%
Zinc
0.29mg
3%
Vitamin B1
0.041mg
3%
Vitamin C
1.7mg
0mg
2%
Choline
13.3mg
2%
Calcium
213mg
205mg
1%
Protein per 100 calories
1.3g
0g
N/A
Calories per 10 g protein
746kcal
N/A
Weight per 100 calories
22g
34g
N/A
Unsaturated / Saturated Fat ratio
0.47
4.6
N/A
Net carbs
62.61g
74.73g
N/A
Sugar
56.92g
74.72g
N/A
Vitamin B2
0.002mg
0%
Macronutrient Comparison
Macronutrient breakdown side-by-side comparison
2
6%
21%
64%
7%
2%
Protein:
6.19 g
Fats:
21.19 g
Carbs:
63.81 g
Water:
6.79 g
Other:
2.02 g
3
75%
22%
3%
Protein:
0 g
Fats:
0.1 g
Carbs:
74.73 g
Water:
21.87 g
Other:
3.3 g
Contains
more
Protein Protein
+∞%
Contains
more
Fats Fats
+21090%
Contains
more
Carbs Carbs
+17.1%
Contains
more
Water Water
+222.1%
Contains
more
Other Other
+63.4%
Fat Type Comparison
Fat type breakdown side-by-side comparison
2
68%
28%
3%
Saturated fat:
Sat. Fat
12.72 g
Monounsaturated fat:
Mono. Fat
5.29 g
Polyunsaturated fat:
Poly. Fat
0.63 g
1
18%
32%
50%
Saturated fat:
Sat. Fat
0.018 g
Monounsaturated fat:
Mono. Fat
0.032 g
Polyunsaturated fat:
Poly. Fat
0.05 g
Contains
more
Mono. Fat Monounsaturated fat
+16431.3%
Contains
more
Poly. Fat Polyunsaturated fat
+1160%
Contains
less
Sat. Fat Saturated fat
-99.9%