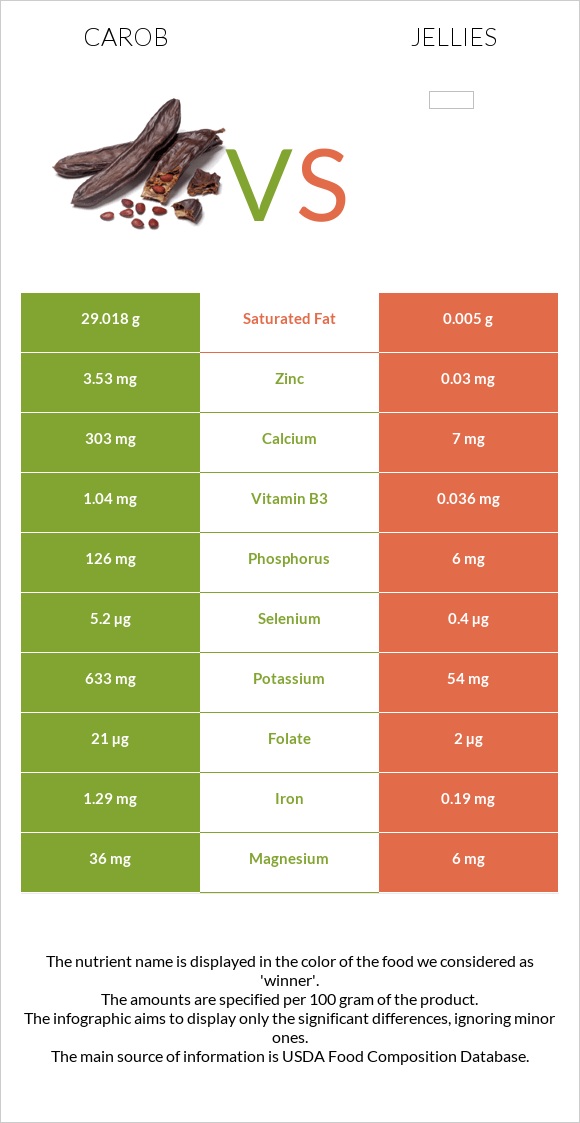
Differences between carob and jellies Carob is higher than jellies in zinc, calcium, copper, phosphorus, potassium, iron, vitamin B2, vitamin B12, and fiber. Carob's daily need coverage for saturated fat is 145% higher. Jellies have less saturated fat. The food types used in this comparison are Candies, carob, unsweetened and Jellies .
Infographic
Mineral Comparison
Mineral comparison score is based on the number of minerals by which one or the other food is richer. The "coverage" charts below show how much of the daily needs can be covered by 300 grams of the food.
8
100 g
300 g
1 oz - 28.35g 1 bar (3 oz) - 87g
Magnesium
Magnesium
Calcium
Calcium
Potassium
Potassium
Iron
Iron
Copper
Copper
Zinc
Zinc
Phosphorus
Phosphorus
Sodium
Sodium
Manganese
Manganese
Selenium
Selenium
26%
91%
56%
48%
61%
96%
54%
14%
18%
28%
1
100 g
300 g
1 packet (0.5 oz) - 14g 1 serving 1 tbsp - 21g
Magnesium
Magnesium
Calcium
Calcium
Potassium
Potassium
Iron
Iron
Copper
Copper
Zinc
Zinc
Phosphorus
Phosphorus
Sodium
Sodium
Manganese
Manganese
Selenium
Selenium
4.3%
2.1%
4.8%
7.1%
3.7%
0.82%
2.6%
3.9%
17%
2.2%
Vitamin Comparison
Vitamin comparison score is based on the number of vitamins by which one or the other food is richer. The "coverage" charts below show how much of the daily needs can be covered by 300 grams of the food.
10
100 g
300 g
1 oz - 28.35g 1 bar (3 oz) - 87g
Vitamin C
Vit. C
Vitamin D
Vit. D
Vitamin A
Vit. A
Vitamin E
Vit. E
Vitamin B1
Vit. B1
Vitamin B2
Vit. B2
Vitamin B3
Vit. B3
Vitamin B5
Vit. B5
Vitamin B6
Vit. B6
Vitamin B12
Vit. B12
Vitamin K
Vit. K
Folate
Folate
1.7%
0%
0.33%
31%
25%
41%
20%
45%
30%
35%
19%
16%
1
100 g
300 g
1 packet (0.5 oz) - 14g 1 serving 1 tbsp - 21g
Vitamin C
Vit. C
Vitamin D
Vit. D
Vitamin A
Vit. A
Vitamin E
Vit. E
Vitamin B1
Vit. B1
Vitamin B2
Vit. B2
Vitamin B3
Vit. B3
Vitamin B5
Vit. B5
Vitamin B6
Vit. B6
Vitamin B12
Vit. B12
Vitamin K
Vit. K
Folate
Folate
3%
0%
0%
0%
0.25%
6%
0.68%
12%
4.6%
0%
0.75%
1.5%
All nutrients comparison - raw data values
Nutrient
DV% diff.
Saturated fat
29.018g
0.005g
132%
Fats
31.36g
0.02g
48%
Zinc
3.53mg
0.03mg
32%
Calcium
303mg
7mg
30%
Copper
0.183mg
0.011mg
19%
Potassium
633mg
54mg
17%
Phosphorus
126mg
6mg
17%
Protein
8.15g
0.15g
16%
Calories
540kcal
266kcal
14%
Iron
1.29mg
0.19mg
14%
Vitamin B2
0.178mg
0.026mg
12%
Vitamin B12
0.28µg
0µg
12%
Fiber
3.8g
1g
11%
Vitamin B5
0.75mg
0.197mg
11%
Vitamin E
1.57mg
0mg
10%
Selenium
5.2µg
0.4µg
9%
Vitamin B1
0.1mg
0.001mg
8%
Vitamin B6
0.13mg
0.02mg
8%
Magnesium
36mg
6mg
7%
Vitamin B3
1.04mg
0.036mg
6%
Vitamin K
7.7µg
0.3µg
6%
Carbs
56.29g
69.95g
5%
Folate
21µg
2µg
5%
Sodium
107mg
30mg
3%
Choline
19mg
10.3mg
2%
Polyunsaturated fat
0.295g
0.004g
2%
Monounsaturated fat
0.483g
0.001g
1%
Protein per 100 calories
1.5g
0.06g
N/A
Calories per 10 g protein
663kcal
17733kcal
N/A
Weight per 100 calories
19g
38g
N/A
Unsaturated / Saturated Fat ratio
0.03
1
N/A
Vitamin C
0.5mg
0.9mg
0%
Net carbs
52.49g
68.95g
N/A
Cholesterol
1mg
0mg
0%
Sugar
34.11g
51.22g
N/A
Vitamin A
1µg
0µg
0%
Manganese
0.14mg
0.132mg
0%
Macronutrient Comparison
Macronutrient breakdown side-by-side comparison
3
8%
31%
56%
3%
Protein:
8.15 g
Fats:
31.36 g
Carbs:
56.29 g
Water:
1.54 g
Other:
2.66 g
2
70%
30%
Protein:
0.15 g
Fats:
0.02 g
Carbs:
69.95 g
Water:
29.77 g
Other:
0.11 g
Contains
more
Protein Protein
+5333.3%
Contains
more
Fats Fats
+156700%
Contains
more
Other Other
+2318.2%
Contains
more
Carbs Carbs
+24.3%
Contains
more
Water Water
+1833.1%
Fat Type Comparison
Fat type breakdown side-by-side comparison
2
97%
Saturated fat:
Sat. Fat
29.018 g
Monounsaturated fat:
Mono. Fat
0.483 g
Polyunsaturated fat:
Poly. Fat
0.295 g
1
50%
10%
40%
Saturated fat:
Sat. Fat
0.005 g
Monounsaturated fat:
Mono. Fat
0.001 g
Polyunsaturated fat:
Poly. Fat
0.004 g
Contains
more
Mono. Fat Monounsaturated fat
+48200%
Contains
more
Poly. Fat Polyunsaturated fat
+7275%
Contains
less
Sat. Fat Saturated fat
-100%