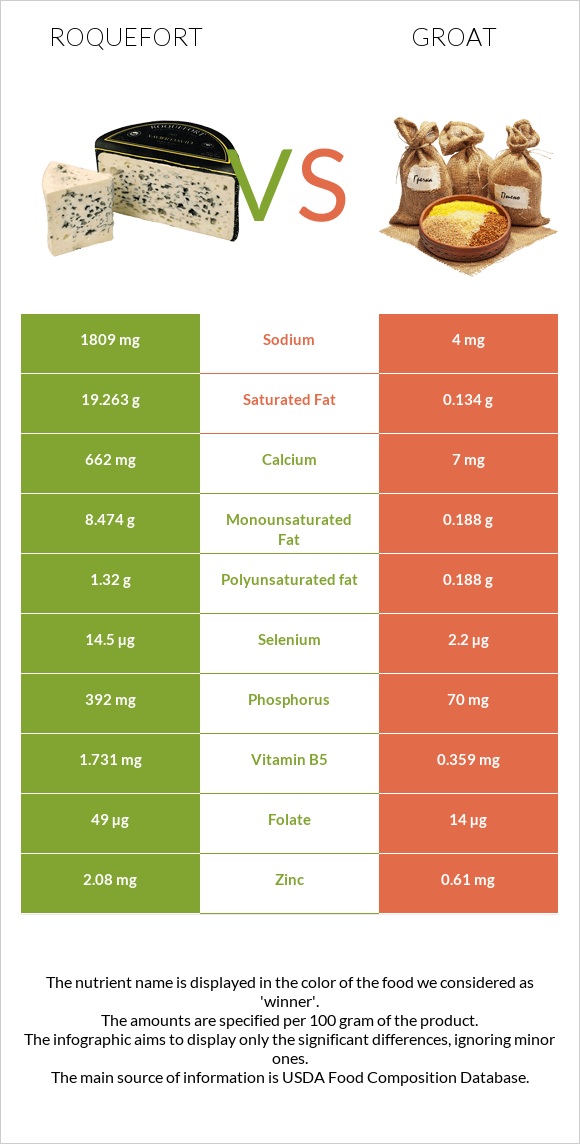
What are the differences between roquefort and groat? Roquefort is higher in calcium and vitamin B12; however, groat is richer in copper, manganese, magnesium, fiber, and vitamin B3. Groat's daily need coverage for copper is 118% more. Roquefort has a lower glycemic index (27) than groat (54). We used Cheese, roquefort and Buckwheat types in this article.
Infographic
Mineral Comparison
Mineral comparison score is based on the number of minerals by which one or the other food is richer. The "coverage" charts below show how much of the daily needs can be covered by 300 grams of the food.
3
100 g
300 g
1 oz - 28.35g 1 package (3 oz) - 85g
Magnesium
Magnesium
Calcium
Calcium
Potassium
Potassium
Iron
Iron
Copper
Copper
Zinc
Zinc
Phosphorus
Phosphorus
Sodium
Sodium
Manganese
Manganese
Selenium
Selenium
21%
199%
8%
21%
11%
57%
168%
236%
3.9%
79%
7
100 g
300 g
1 cup - 170g
Magnesium
Magnesium
Calcium
Calcium
Potassium
Potassium
Iron
Iron
Copper
Copper
Zinc
Zinc
Phosphorus
Phosphorus
Sodium
Sodium
Manganese
Manganese
Selenium
Selenium
165%
5.4%
41%
83%
367%
65%
149%
0.13%
170%
45%
Vitamin Comparison
Vitamin comparison score is based on the number of vitamins by which one or the other food is richer. The "coverage" charts below show how much of the daily needs can be covered by 300 grams of the food.
5
100 g
300 g
1 oz - 28.35g 1 package (3 oz) - 85g
Vitamin C
Vit. C
Vitamin D
Vit. D
Vitamin A
Vit. A
Vitamin E
Vit. E
Vitamin B1
Vit. B1
Vitamin B2
Vit. B2
Vitamin B3
Vit. B3
Vitamin B5
Vit. B5
Vitamin B6
Vit. B6
Vitamin B12
Vit. B12
Vitamin K
Vit. K
Folate
Folate
0%
0%
98%
0%
10%
135%
14%
104%
29%
80%
0%
37%
3
100 g
300 g
1 cup - 170g
Vitamin C
Vit. C
Vitamin D
Vit. D
Vitamin A
Vit. A
Vitamin E
Vit. E
Vitamin B1
Vit. B1
Vitamin B2
Vit. B2
Vitamin B3
Vit. B3
Vitamin B5
Vit. B5
Vitamin B6
Vit. B6
Vitamin B12
Vit. B12
Vitamin K
Vit. K
Folate
Folate
0%
0%
0%
0%
25%
98%
132%
74%
48%
0%
0%
23%
All nutrients comparison - raw data values
Nutrient
DV% diff.
Copper
0.034mg
1.1mg
118%
Saturated fat
19.263g
0.741g
84%
Sodium
1809mg
1mg
79%
Calcium
662mg
18mg
64%
Manganese
0.03mg
1.3mg
55%
Magnesium
30mg
231mg
48%
Fats
30.64g
3.4g
42%
Fiber
0g
10g
40%
Vitamin B3
0.734mg
7.02mg
39%
Vitamin A
294µg
0µg
33%
Cholesterol
90mg
0mg
30%
Vitamin B12
0.64µg
0µg
27%
Carbs
2g
71.5g
23%
Iron
0.56mg
2.2mg
21%
Monounsaturated fat
8.474g
1.04g
19%
Protein
21.54g
13.25g
17%
Vitamin B2
0.586mg
0.425mg
12%
Potassium
91mg
460mg
11%
Selenium
14.5µg
8.3µg
11%
Vitamin B5
1.731mg
1.233mg
10%
Vitamin B6
0.124mg
0.21mg
7%
Phosphorus
392mg
347mg
6%
Vitamin B1
0.04mg
0.101mg
5%
Folate
49µg
30µg
5%
Zinc
2.08mg
2.4mg
3%
Polyunsaturated fat
1.32g
1.039g
2%
Calories
369kcal
343kcal
1%
Protein per 100 calories
5.8g
3.9g
N/A
Calories per 10 g protein
171kcal
259kcal
N/A
Weight per 100 calories
27g
29g
N/A
Unsaturated / Saturated Fat ratio
0.51
2.8
N/A
Net carbs
2g
61.5g
N/A
Tryptophan
0.303mg
0.192mg
0%
Threonine
0.965mg
0.506mg
0%
Isoleucine
1.217mg
0.498mg
0%
Leucine
2.114mg
0.832mg
0%
Lysine
1.848mg
0.672mg
0%
Methionine
0.558mg
0.172mg
0%
Phenylalanine
1.023mg
0.52mg
0%
Valine
1.614mg
0.678mg
0%
Histidine
0.602mg
0.309mg
0%
Macronutrient Comparison
Macronutrient breakdown side-by-side comparison
4
22%
31%
2%
39%
6%
Protein:
21.54 g
Fats:
30.64 g
Carbs:
2 g
Water:
39.38 g
Other:
6.44 g
1
13%
3%
72%
10%
2%
Protein:
13.25 g
Fats:
3.4 g
Carbs:
71.5 g
Water:
9.75 g
Other:
2.1 g
Contains
more
Protein Protein
+62.6%
Contains
more
Fats Fats
+801.2%
Contains
more
Water Water
+303.9%
Contains
more
Other Other
+206.7%
Contains
more
Carbs Carbs
+3475%
Fat Type Comparison
Fat type breakdown side-by-side comparison
2
66%
29%
5%
Saturated fat:
Sat. Fat
19.263 g
Monounsaturated fat:
Mono. Fat
8.474 g
Polyunsaturated fat:
Poly. Fat
1.32 g
1
26%
37%
37%
Saturated fat:
Sat. Fat
0.741 g
Monounsaturated fat:
Mono. Fat
1.04 g
Polyunsaturated fat:
Poly. Fat
1.039 g
Contains
more
Mono. Fat Monounsaturated fat
+714.8%
Contains
more
Poly. Fat Polyunsaturated fat
+27%
Contains
less
Sat. Fat Saturated fat
-96.2%